WiFi Path Loss Calculator
Estimate free-space loss, indoor wall attenuation, link budget, RSSI, fade margin, MCS quality, and AP band fit for home labs and wireless networks.
📶Named Wi-Fi Presets
⚙Radio and Path Inputs
🧱Walls, Floors, and Materials
📊Live Band Comparison Grid
2.4 GHz AP
5 GHz AP
6 GHz AP
📐Formula Reference
FSPL(dB) = 32.44 + 20 log10(distance km) + 20 log10(frequency MHz)
Indoor path loss add-on
Indoor loss(dB) = material losses + floor losses + clutter + channel penalty + fade margin
Received signal estimate
RSSI(dBm) = TX power + AP antenna gain + client antenna gain - cable loss - total path loss
💻AP and Band Planning Specs
🛠Material Loss Table
| Material | Typical 2.4 GHz Loss | Typical 5 GHz Loss | Planning Note |
|---|---|---|---|
| Drywall / hollow wall | 2 to 4 dB | 3 to 5 dB | Usually tolerable for one or two rooms |
| Wood door / furniture wall | 3 to 6 dB | 4 to 7 dB | Bookcases and cabinets add scatter |
| Brick / masonry | 6 to 10 dB | 8 to 12 dB | Place AP on same side when possible |
| Concrete / block | 10 to 16 dB | 12 to 20 dB | Often needs another AP or wired backhaul |
| Coated glass / mirror | 4 to 9 dB | 6 to 12 dB | Low-E coatings can behave like metal film |
| Floor / ceiling | 8 to 14 dB | 10 to 18 dB | Vertical links are usually weak |
📡Band and Channel Width Table
| Band / Width | Range Behavior | Noise Penalty | Best Use |
|---|---|---|---|
| 2.4 GHz / 20 MHz | Best wall penetration | 0 dB baseline | IoT, distant rooms, legacy clients |
| 5 GHz / 40 MHz | Balanced indoor range | 3 dB vs 20 MHz | Stable laptop and streaming links |
| 5 GHz / 80 MHz | Shorter but faster | 6 dB vs 20 MHz | Modern rooms near an AP |
| 6 GHz / 160 MHz | Shortest indoor reach | 9 dB vs 20 MHz | High capacity, same-room clients |
| 6 GHz / 320 MHz | Very short high rate | 12 dB vs 20 MHz | Wi-Fi 7 close-range throughput |
🏠Common Home Lab Scenarios
| Scenario | Expected Target | Suggested Margin | Planning Move |
|---|---|---|---|
| Same-room office desk | -45 to -60 dBm | 8 to 10 dB | Use 5 GHz or 6 GHz for speed |
| Bedroom through two walls | -62 to -72 dBm | 10 to 15 dB | Keep AP central and above furniture |
| Garage camera | -67 to -78 dBm | 15 dB | Try 2.4 GHz or add outdoor AP |
| Mesh wireless backhaul | -55 to -65 dBm | 15 to 20 dB | Keep nodes in strong overlap zones |
| Outdoor bridge | -50 to -65 dBm | 20 dB | Use directional antennas and clear line of sight |
📘RSSI Quality and Service Targets
| RSSI Range | Quality | Typical Service | Action |
|---|---|---|---|
| -30 to -55 dBm | Excellent | High MCS, low retries | Use wider channels if spectrum is clean |
| -56 to -67 dBm | Good | Voice, roaming, video calls | Good planning target for primary rooms |
| -68 to -75 dBm | Fair | Browsing and streaming | Expect lower rates and more retries |
| -76 to -82 dBm | Weak | Basic connectivity | Add AP, reduce obstacles, or use 2.4 GHz |
| Below -82 dBm | Poor | Unstable edge coverage | Do not rely on this for roaming clients |
💡Planning Tips
Physics interferes with your video call, freezing up right as you enter kitchen. The internet didn’t just get slow. It got frustrated trying to pass around drywall, a fridge, perhaps a plant. And that frustration? That’s called path loss. When you understands it, Wi-Fi stops being a mystery and becomes something you can manage: you’re managing materials and distance. That’s where free-space path loss comes in…
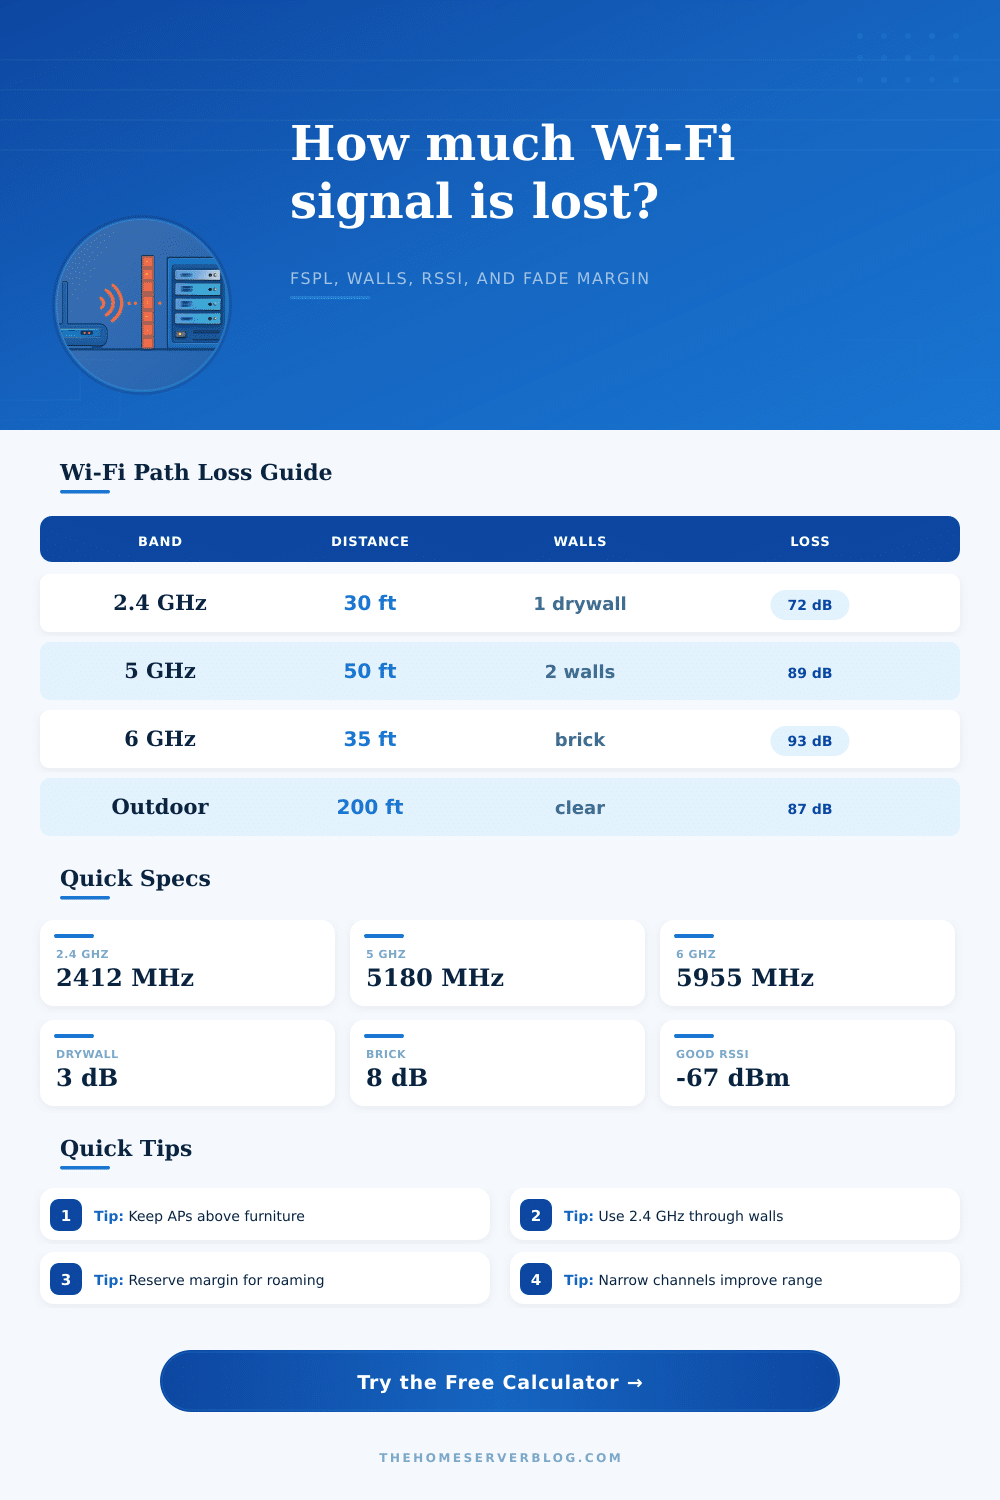
It describes how much a signal degrade as it travels through open air. As frequencies increase, they degrades faster. That’s why 6 GHz doesn’t reach your backyard; it just hits the other side of the living room while 2.4 GHz do.
What is Path Loss
That calculator above do the simple physics for you. You input the distance and desired frequency, and it spits out a base-line loss amount.
Homes aren’t completely empty. Radio signals will gets absorbed by walls. Concrete walls block radio waves altogether. A single brick wall can consumes over ten decibels of signal. That’s a huge drop off. So the signal that makes it to your phone may only be a hundredth of what was sent from router. Every hurdle along that journey has to be accounted for.
The tool allows you to count wood doors, drywall panels, even the floor! All of those reduces the signal strength. Don’t forget about furnitures. A metal filing cabinet or a tall book shelf behaves like a partial wall, they scatter the energy. The calculator adds all of the losses up into a single path loss number.
That number matter because it figures into your link budget. Link budget is the difference between the strength of the signal from the access point and the weakest signal your device can handle before it drops the connection. Sensitivity determines range, but most of us care about throughput instead. To reliably recieve data, your phone must has sufficient signal strength. Drops occur when your estimated signal strength is lower then what is needed.
For streaming or voice calls, aim for -67 dBm or better. Any lower encourages lag and retransmissions. Before purchasing new equipment, use the calculator to see whether your setup reaches that mark. Compared with typical receiver sensitivities, it estimate your expected signal and tells you whether the link is feasible.
Another tradeoff is the width of your channel. A wider channel has higher speed, but it also increases the noise floor and therefore decreases the actual range of your network. Narrowing down your channel’s width will increase headroom for your signal over other background interference and make the signal more stable. Sometimes having a stable connection at 40 megahertz is preferable different than a connection that loses packets all the time because it’s operating at 160 megahertz. The tool takes this penalty into account in the final calculation, so you’ll see how much additional loss wide bandwidths result in.
Where you put it also count. The higher on the wall it is, the better. It should of be out of reach of most furniture and away from clutter down low. The closer to the middle it is, the better, because there are fewer walls between client and the AP. And don’t expect a lot of antenna gain to make up for huge path loss if you have to span a great distance across space, or punch through thick masonry. You’ll want an intermediate node nearer to your device.
Strong backhaul links is key with mesh systems. Putting a satellite in the dead zone repeats its weakness throughout. View your house like a chain of filters; every appliance, door and wall absorbs some amount of that signal’s energy. So what you want is for enough to survive so it can be decoded reliabley.
If you don’t have precise measurements, use the reference tables on this page to approximate the loss caused by materials. They offer reasonable approximations based off typical household construction. That way, guesswork becomes planning. Instead of mindlessly flailing around with your routers, you’re putting them in places intentionaly. Distance still diminishes the signal, but at least now you know precisely when and why.