Container Memory Limit Calculator
Estimate Kubernetes-style memory requests, limits, pod footprint, node density, and OOM risk from RSS, heap, native memory, page cache, sidecars, replicas, and safety headroom.
⚙ Workload Presets
📊 Memory Inputs
Sizing Results
Memory Request
896 MiB per pod scheduler requestMemory Limit
1280 MiB per pod cgroup limitPod Memory
960 MiB estimated peak before headroomNode Fit
9 pods by request on this nodeOOM Risk
Moderate Watch heap and cache growthTotal Deployment
3.75 GiB replica limits combinedDeployment requests use 33% of the node allocatable memory.
🧮 Memory Reference Cards
📋 Container Workload Memory Presets
| Preset | App RSS | Heap | Native | Page Cache | Sidecar | Typical Safety |
|---|---|---|---|---|---|---|
| Go API Pod | 180 MiB | 96 MiB | 48 MiB | 48 MiB | 64 MiB | 20% |
| Node.js API | 320 MiB | 256 MiB | 64 MiB | 96 MiB | 96 MiB | 25% |
| Spring Boot JVM | 768 MiB | 512 MiB | 192 MiB | 128 MiB | 128 MiB | 30% |
| Python Worker | 420 MiB | 256 MiB | 96 MiB | 128 MiB | 64 MiB | 25% |
| Nginx Proxy | 96 MiB | 16 MiB | 32 MiB | 128 MiB | 32 MiB | 15% |
| PHP-FPM Pool | 512 MiB | 384 MiB | 128 MiB | 128 MiB | 64 MiB | 25% |
| Redis Cache | 1536 MiB | 128 MiB | 192 MiB | 64 MiB | 64 MiB | 20% |
| Postgres Pod | 2048 MiB | 512 MiB | 512 MiB | 1024 MiB | 128 MiB | 25% |
| Search Node | 4096 MiB | 2048 MiB | 512 MiB | 1024 MiB | 128 MiB | 30% |
| CI Runner | 1024 MiB | 512 MiB | 512 MiB | 2048 MiB | 128 MiB | 35% |
| ML Inference | 6144 MiB | 2048 MiB | 1024 MiB | 512 MiB | 128 MiB | 30% |
| Mesh Sidecar App | 384 MiB | 256 MiB | 96 MiB | 96 MiB | 192 MiB | 30% |
🗂 Memory Component Reference
| Component | What It Includes | Planning Range | Sizing Note |
|---|---|---|---|
| App RSS | Resident pages currently used by the main process | 64 MiB to 8 GiB+ | Use p95 or p99 under load, not idle startup RSS. |
| Heap Memory | Managed runtime heap for JVM, V8, Go, .NET, or PHP | 25% to 75% of pod | Keep heap below the final limit so native and cache can breathe. |
| Native Memory | Stacks, direct buffers, mmap, libc, TLS, JIT, allocator arenas | 64 MiB to 1 GiB+ | JVM and ML workloads often need a larger native allowance. |
| Page Cache | Filesystem cache charged to the cgroup on Linux | 5% to 30% of pod | Large log, index, and model reads can push cache toward the limit. |
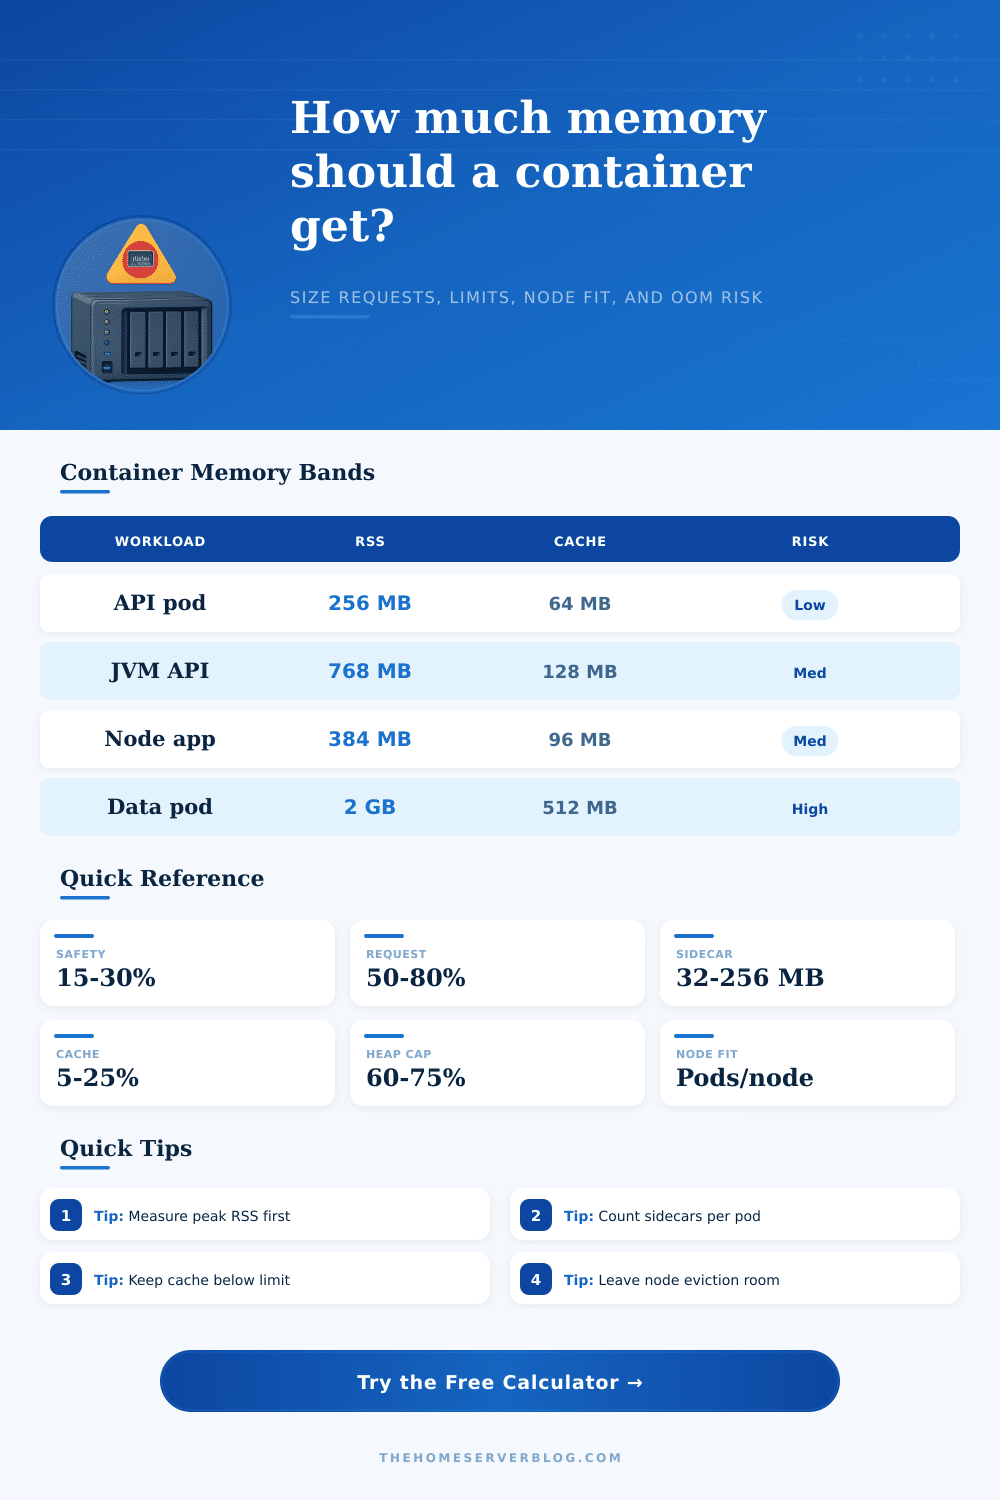
| Sidecar Memory | Service mesh proxy, logging agent, security agent, metrics exporter | 32 MiB to 256 MiB each | Count sidecars in every pod, not once per deployment. |
| OOM Safety | Headroom for allocator spikes, traffic bursts, and measurement error | 15% to 35% | Use more headroom for bursty, stateful, or cache-heavy pods. |
⚖ Runtime Comparison Grid
| Runtime | Memory Shape | Limit Strategy | Common OOM Cause |
|---|---|---|---|
| Go | Heap plus goroutine stacks and GC pacing | Set GOMEMLIMIT below the pod limit | Heap target ignores sidecar and page cache. |
| JVM | Heap, metaspace, code cache, direct buffers, thread stacks | Use MaxRAMPercentage with native allowance | Xmx sized too close to container limit. |
| Node.js | V8 heap plus native addons and buffers | Set max-old-space-size below the limit | Buffer growth outside the V8 heap. |
| Python | Interpreter objects, native libraries, worker processes | Measure per worker and multiply carefully | Forked workers duplicate dirty pages. |
| .NET | Managed heap, JIT, native libraries, thread stacks | Use container-aware GC limits | Server GC and thread pools expand under load. |
| PHP-FPM | Per-child RSS plus OPcache and extensions | Size children before setting pod memory | Too many FPM children inside one pod. |
| Rust/C++ | Native heap, arenas, mmap, thread stacks | Reserve for allocator fragmentation | Unbounded caches and native fragmentation. |
| Database | Buffer pool, WAL, connections, page cache | Limit carefully; leave IO cache headroom | Buffer pool plus kernel page cache collide. |
📐 Request and Limit Guidance
| Request Ratio | Best For | Scheduler Effect | Tradeoff |
|---|---|---|---|
| 40% to 55% | Burst-heavy web frontends | Higher apparent node density | More eviction and contention risk during bursts. |
| 60% to 75% | Most API and worker pods | Balanced bin packing | Requires good measurement of peak usage. |
| 80% to 90% | Stateful or latency-sensitive pods | Conservative placement | Lower node utilization, fewer noisy-neighbor issues. |
| 100% | Guaranteed QoS when CPU also matches | Requests equal limits | Least flexible, but most predictable. |
⚠ OOM Risk Checklist
| Signal | Low Risk | Medium Risk | High Risk |
|---|---|---|---|
| Safety headroom | 25% or more | 15% to 24% | Below 15% |
| Request ratio | 70% to 90% | 50% to 69% | Below 50% |
| Cache share | Below 15% | 15% to 30% | Above 30% |
| Node request load | Below 70% | 70% to 90% | Above 90% |
| Runtime behavior | Bounded heap and caches | Some unbounded buffers | Unknown peak or unbounded cache |
💡 Practical Container Memory Tips
That’s the tricky part about setting memory limits for containers. You have no idea precisely how much space each piece of data will take up, beyond some rough estimate based off knowing approximately how big it will be in the cluster. You also don’t know how resources will move around as data passes through. This can lead to half of the cluster being wasted due to inefficient usage, or even worse, having pods keep getting restarted if they runs out of memory.
This simple arithmetic is sometimes the line between a stable cluster and an unstable one. Just because your application might ask for X amount of memory in your application’s source code doesn’t mean that’s all that gets used by your runtime at scale. Or OS caches stuff in the background. Sidecar processes also consume memory behind the scenes.
How to Set Memory Limits for Containers
The first thing most engineers look at is their app’s heap size. If they’re deploying a JVM service, they’ll see the Xmx flag and think that covers it all. That’s where people go wrong. The heap is only one piece of your total resident set size. There’s also non-heap (native) memory: thread stacks, direct buffers, allocator overhead, code caches, etc. This other 10 to 20 percent or more of your container’s footprint can easily be accounted for in Java environments. Set your limit at precisely equal to your max heap and the next time your process tries to take a breath, the kernel kills it.
By splitting out native from heap memory, the calculator forces you to recognize there is memory beyond your managed runtime… Something the calculator show. And then there’s page cache. When you read lots of model weights off disk or load a big log file, the Linux kernel charges those reads to your container cgroup. This can add up fast if you have a CI runner pulling down huge amounts of artifacts or a database pod writing them. While a stateless API may hardly touch your cache, it can still count towards your limit. Your storage layer becomes a memory leak if you ignore this variable. You’ve got to guess at how much data will live on disk vs RAM under load. If your app pulls regularly from local volumes, that cache cost is real and has to be accounted for along with your heap size.
Another thing people tend to forget about are sidecars. Logging agents, security scanners and service mesh proxies takes up memory too. Each one may be fine on their own; maybe it’s just a few megs in terms of total memory usage, but if you have a dozen copies of that deployment running as pods, it adds up fast. To account for this, the tool lets you specify how much memory sidecar container use per pod. This way, your scheduler requests can take into account the real-world cost of a given number of replicas.
And here’s why request versus limit matters: The request determines where the Kubernetes scheduler puts the pod. That’s where the pod lives. If your limit is too low, it’ll trigger the OOM killer. If you set both values too tightly, you’re leaving no room for your pod to burst. If you set both values too far apart, you encourage the pod to use more then it asked for, becoming a noisy neighbor. A little safety headroom goes a long way.
A good rule of thumb is to allocate an additional 15-30% over what you measure as your peak workload to account for both measurement error and spikes in traffic. That’s the safety buffer that saves your pods when stuff gets weird. Otherwise, you’re gambling. If you don’t have historical metrics, the page has some preset values for common workloads (e.g. Spring Boot services or Go APIs) which will give you a starting point.
Presets are just that though: a guideline. They should of been validated against your performance tests. Don’t use startup memory, as this is misleadingly low (caches are empty, heaps are uninitialized). Use the resident set size measured under realistic load instead. This is where peak usage shows the truth.
In conclusion: Container sizing is a repeating process. First, make guesses based on your estimates, deploy to staging, see what resources are actualy used, tweak accordingly, repeat. Don’t be penny-wise and pound-foolish. Instead, aim for the sweet spot of providing enough headroom for handling spikes while avoiding too much idle capacity.
With memory limits as a dynamic budget. Not a static config setting, your clusters become predictable. Your scheduling decisions will no longer fight each other, so you can trust them again. This brings clarity to the chaos. It transforms a chaotic deployment into a manageable operation so you can focus on building features instead of debugging resource exhaustion.