Container CPU Limit Calculator
Size Kubernetes CPU requests, CPU limits, replica placement, node fit, burst tolerance, sidecar overhead, and throttling risk for containers measured in millicores.
Millicores from metrics such as container_cpu_usage_seconds_total.
Short busy-period peak before adding sidecars and headroom.
Allowed throttled time as a fraction of runnable time.
Higher values allow bursts but can hide noisy-neighbor risk.
Pods running the same app container and sidecar set.
Use allocatable cores after kubelet and system reservations.
Seconds the pod needs to run near peak CPU.
Sets request headroom and throttling penalty weight.
Add service mesh, log shipper, proxy, or agent CPU in millicores.
Extra space for DaemonSets, kubelet, interrupts, and spikes.
App average plus sidecar CPU per pod.
App peak plus sidecar CPU per pod.
CPU requested by all replicas together.
Approximate quota per 100ms period.
| Kubernetes Value | Meaning | Scheduler Effect | Runtime Effect |
|---|---|---|---|
| 100m | 0.1 CPU core | Consumes 0.1 core of node allocatable. | Shares weight if no limit is set. |
| 500m | 0.5 CPU core | Half a core requested for placement. | Can burst if node has idle CPU. |
| 1000m | 1 CPU core | One full core of request capacity. | Limit maps near one core quota. |
| 2000m | 2 CPU cores | Two cores requested per pod. | Quota allows about two cores when limited. |
| CPU Field | Best Use | Too Low | Too High |
|---|---|---|---|
| Request | Placement and guaranteed shares. | Eviction and noisy contention. | Poor bin packing. |
| Limit | Cap runaway CPU usage. | CFS throttling and latency spikes. | Weak isolation. |
| Ratio | Burst allowance above request. | No burst room. | Unpredictable peaks. |
| Sidecar | Pod-level capacity math. | Understates real pod demand. | Wastes node slots. |
| Control | cgroup v1 | cgroup v2 | What To Watch |
|---|---|---|---|
| CPU quota | cpu.cfs_quota_us | cpu.max | Low quota creates throttled periods. |
| CPU period | cpu.cfs_period_us | cpu.max period | 100000 us is common in Kubernetes. |
| CPU shares | cpu.shares | cpu.weight | Request maps to relative CPU weight. |
| Throttled count | cpu.stat | cpu.stat | Rising throttled_usec means limit pressure. |
| CPU pressure | PSI on newer hosts | cpu.pressure | Shows waiting time even without limits. |
containerd
Kubernetes default on many clusters. CPU request and limit values are passed through CRI to runc or another OCI runtime.
CRI-O
Common on OpenShift and Kubernetes-focused hosts. Behavior follows cgroup settings closely, so quota math remains the same.
Docker Engine
Uses equivalent CPU shares, quota, and period controls. Good for local testing, but cluster scheduling still depends on requests.
gVisor
Adds a userspace kernel layer. Keep more request headroom for syscall-heavy services and latency-sensitive endpoints.
Kata Containers
Runs pods in lightweight VMs. Account for sandbox overhead and avoid tiny CPU requests for production services.
Windows Containers
CPU controls differ by isolation mode, so validate throttling and quota behavior with platform-specific metrics.
| Workload | Typical Request | Typical Limit | Practical Note |
|---|---|---|---|
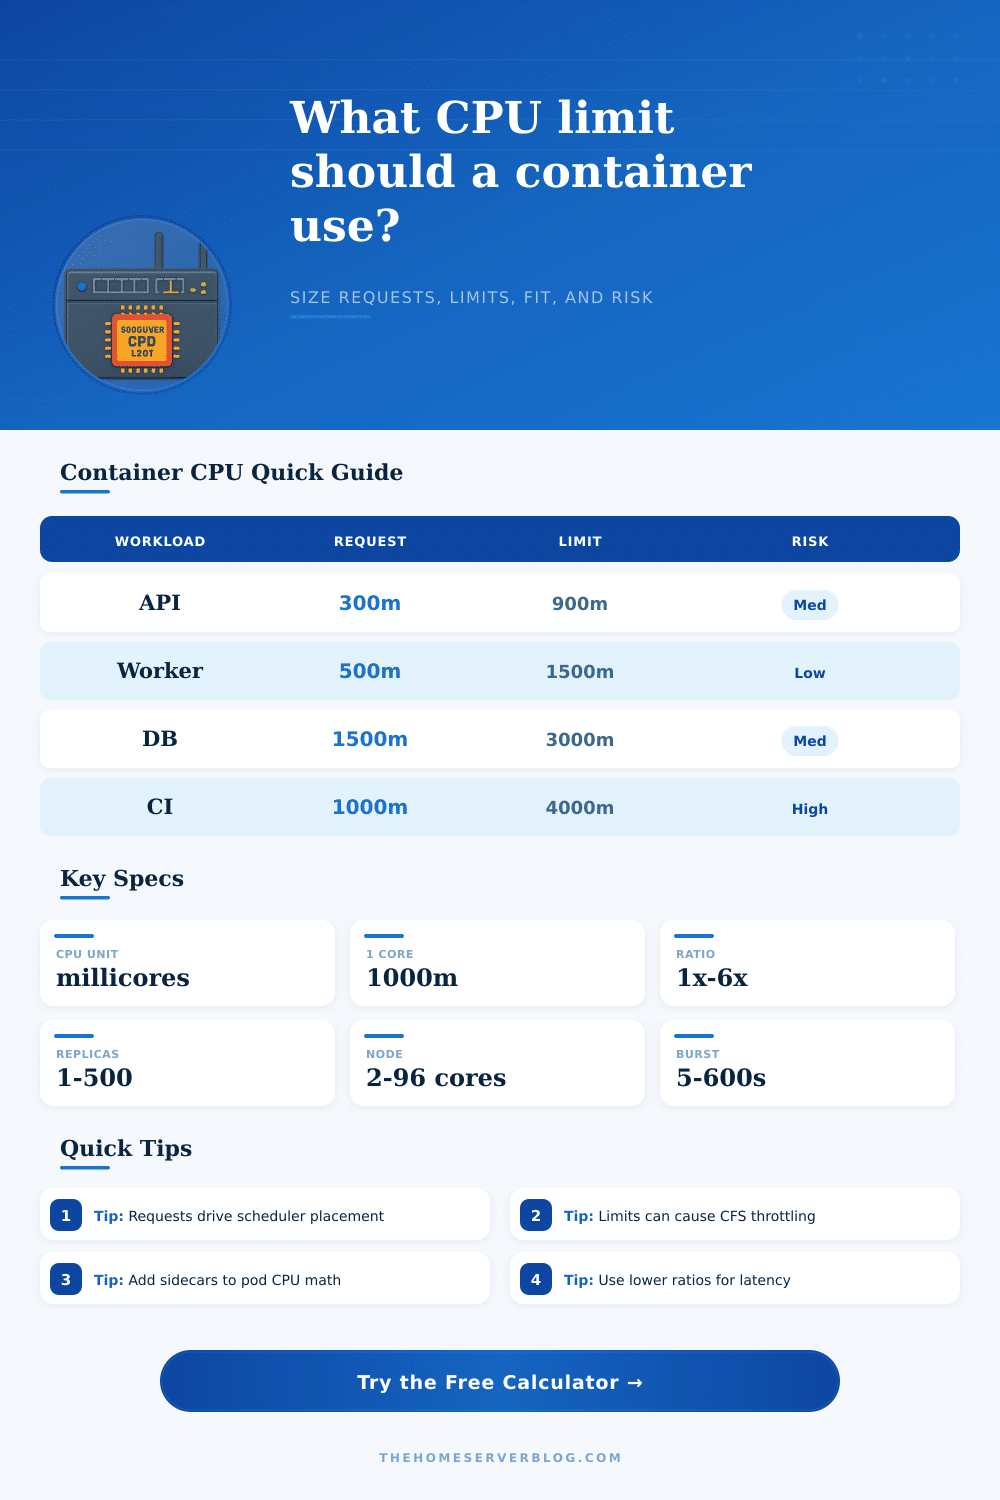
| Small API | 100m to 500m | 2x to 3x request | Watch p95 and p99 latency during burst windows. |
| JVM service | 500m to 2000m | 1.5x to 3x request | Leave room for GC and JIT warmup. |
| Queue worker | 250m to 1500m | 2x to 4x request | Batch systems often tolerate short throttling. |
| Database pod | 1000m to 4000m | 1x to 2x request | Prefer predictable CPU over aggressive burst. |
| CI runner | 1000m to 4000m | 2x to 6x request | Large limits are useful, but isolate runner nodes. |
container_cpu_cfs_throttled_seconds_total with request saturation before raising limits.When your Kubernetes cluster starts acting funky but doesn’t throw any errors, it’s panic time. Health checks is showing green, pods are running, but things start taking seconds instead of milliseconds. You look at the logs and there’s nothing obvious. You look at memory use and everything seems okay. Then you look at CPU metrics and you see that you’ve throttled yourself into nothingness.
That’s what happens when containers don’t perform well, and most of the time it’s because you don’t understand how CPU limits and requests actualy operate. Practical Kubernetes limits and requests is calculated by measuring millicores, replicas, node size, latency needs, sidecars, and peak demand. Use the calculator above. Convert all those measured millicores, replicas, latency needs and more into concrete recommendations. The math’s done for you, so you can start to think about tradeoffs.
How to Set CPU Limits for Kubernetes
Most engineers don’t spend much time thinking about how to configure CPUs; they slap some number on a pod and hope for the best. What they fail to realize is that limits aren’t merely caps, limits are also latency tools. If you set a very strict limit, it protects you from a noisy neighbor… except when that limit is so low, it chops off healthy demand from CFS scheduler. What do you get? The service appears to be underutilized in average metrics, but it falls over at the worst possible moment when someone hits it with a burst of traffic.
That’s what everyone gets wrong. Average doesn’t matter. Only the peaks does. Those are what determine your user experience. Scheduling is determined by requests; how things run is restricted by limits. Why? Because the scheduler doesn’t view limits: it views requests.
For example, say you’re cost-conscious and want to set your request as small as possible so you use fewer nodes. Kubernetes packs as many pods onto each node as requested. And when all those pods wake up at once, they contend for resources. They won’t exceed their limit, that’s enforced. But why do they experience latency spikes due to contention? This happens because there request wasn’t large enough.
The page makes this clear in the reference table. It shows how various types of workloads balance competing demands. For instance, a CI runner can handles high limits with aggressive bursting (since it has flexible deadlines), whereas a database pod must have low burst ratios and predictable CPU. Every workload aren’t one-size-fits-all, otherwise you’re going to pay for inefficiency or sacrifice performance.
Then there’s the unseen weight of sidecars: A pod today almost never consists only of your application container. More likely, it has a log shipper, a telemetry agent or an Envoy proxy tagalong. Those containers eats up CPU as well, and failing to take their impact into consideration when doing your sizing math means starving your app container. Eighty millicores may not sound like much overhead, but multiply by hundreds of replica and it alters the whole capacity budget of your cluster. The tool does this math for you, so that your node fit calculations is grounded in reality, not some idealized assumption.
The other metric we think you should of look out for is throttling risk: what percentage of your runnable time will be spent in a throttled state? Even with as many cores as you want, if your throttled time is more than a tiny fraction of your runnable time, your p99 latency will still be bad. The calculator computes this risk based off your desired burst duration and ratio of requests to limit. Higher ratios means you can do lots of bursting, which helps keep your costs low. But this also means there’s danger of occasional throttles if your workload spikes, which isn’t good if you’re running latency-sensitive stuff. Choose your poison: do you want to pay a bit more for headroom so you know you won’t get throttled, or take the gamble with the occasional throttle to save money?
To conclude, At the end of the day, the size of your container CPU limits isn’t so much about picking the right answer as it is being aware of what each side of the balance means to you. How does reliability play off of efficiency? And how do both balance against isolation? Making decisions based on measured data instead of a gut feeling will help you get past the fear of silent throttling and create predictable clusters that perform well under load. Begin with your metrics, include some realistic headroom, and use math to define your limits, not your fears.