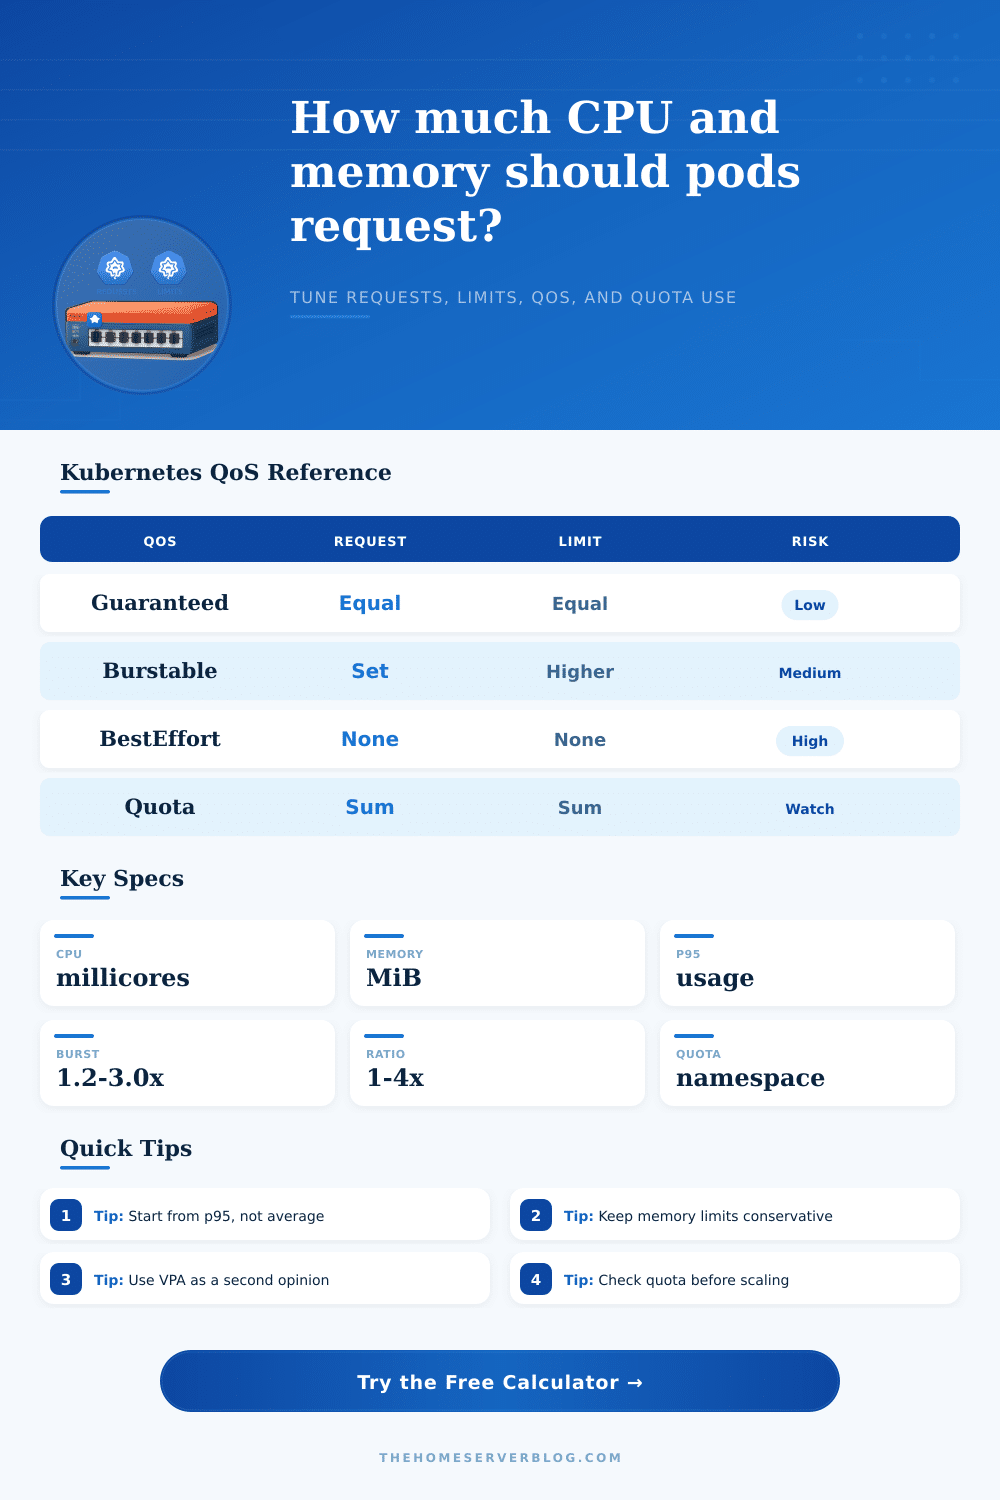
Kubernetes Requests and Limits Calculator
Turn observed baseline usage, p95 usage, burst factor, VPA recommendations, target QoS class, replicas, and namespace quota into practical Kubernetes CPU and memory requests and limits.
resources:
  requests:
    cpu: "500m"
    memory: "720Mi"
  limits:
    cpu: "1000m"
memory: "1228Mi"| QoS class | How Kubernetes assigns it | Eviction behavior | Best fit |
|---|---|---|---|
| Guaranteed | Every container has CPU and memory requests and limits, and each request equals its limit. | Last to be evicted under node pressure, assuming usage stays inside the limits. | Databases, stateful services, critical control plane adjacent workloads. |
| Burstable | At least one request or limit exists, but requests do not all equal limits. | Evicted after BestEffort pods; priority depends on usage above request. | Most web apps, APIs, workers, ingress controllers, and sidecars. |
| BestEffort | No CPU or memory requests or limits are set for any container. | First to be evicted and easiest to starve on busy nodes. | Scratch tasks, local experiments, noncritical jobs with no quota pressure. |
| Signal | Use for request | Use for limit | Practical note |
|---|---|---|---|
| Baseline CPU | Floor for low traffic periods | Not enough by itself | Useful for detecting inflated p95 from rare incidents. |
| p95 CPU | Primary request anchor | Multiplied by burst factor | Pair with throttling metrics before lowering CPU limits. |
| p95 memory | Primary request anchor | Limit with cautious headroom | Memory is not throttled; exceeded limits restart the container. |
| VPA recommendation | Cross-check request | Can inform upper bound | Use VPA trends, not a single short observation window. |
| Namespace quota | Total request budget | Total limit budget | Check both requests and limits before increasing replicas. |
| Workload | Typical CPU request | Typical memory request | Limit strategy |
|---|---|---|---|
| Stateless web API | p95 plus 10-25% | p95 plus 15-30% | CPU 1.5-3x request; memory 1.3-1.8x request. |
| Java service | p95 plus JIT warmup room | Heap, metaspace, native memory | Use memory limits that match JVM container awareness. |
| Queue worker | Scale by concurrency | Scale by batch size | Wide CPU headroom is fine; protect memory carefully. |
| Batch or CronJob | Request enough to finish on time | Peak batch memory plus margin | Prefer limits that avoid noisy neighbor damage. |
| Stateful database | Stable reservation | Working set plus cache target | Guaranteed QoS is often worth the lower bin-packing density. |
| Telemetry agent | Low steady request | Buffer and queue dependent | Cap runaway memory; watch dropped spans or logs. |
This calculator is a planning tool. Final Kubernetes resource values should be validated with application SLOs, autoscaler behavior, node allocatable capacity, PodDisruptionBudgets, and real production telemetry.
You deploy a new service and hope it doesn’t crash. It’s not just about getting the container up but also telling Kubernetes exactly how much memory and CPU you want it to reserve for that task. It feels less like engineering and more like guesswork with your budget at risk. If you set the requests too high, you’re wasting precious cluster resources. Set them too low and when there’s a traffic spike your pod will be throttled, or worse, killed.
Once you plug in your burst and p95 usage factors into the calculator above, it spit out the math for you, saving you time chasing ghosts in the telemetry data. That’s the main point here: how do we determine what’s required for the app to function (baseline CPU), versus what’s required for it to thrive?
How to Choose CPU and Memory Settings
Measuring baseline CPU is straightforward. Sizing requests based on average usage are risky. When you size requests off average usage, in effect you’re betting all users will act politely indefinitely. They won’t. A p95 of actual usage is important because it includes heavy lifting without being unduly influenced by infrequent, isolated occurrences. The tool treats this number as its starting point, then applies a safety margin to ensure the scheduler understand your pod isn’t idling along.
Memory is different than CPU because memory cannot be compressed. If a pod use too much CPU, it is slowed down but still runs. However, hitting your memory limit gets your pod OOMKilled. There is no throttling on RAM; there is only death. That makes limits behave in different ways. You might want to allow extra CPU use so stateless web servers can run faster when needed. However, you do not want that same freedom with memory, where you will need a stricter limit. The memory limit offers different headroom styles, so the calculator allows you to adjust accordingly. Giving yourself a wider limit here doesn’t increase performance; it invites instability.
These choices become policy within Quality of Service classes. If you set requests equal to limits (and you should), then Kubernetes will label the resulting pod as Guaranteed. During times of node pressure, these pods receive preferential treatment; they continue to live longer than their peers. That’s a luxurius reserved for stateful workloads such as databases which can’t tolerate restarting. Most application servers lives comfortably in the sweet spot of Burstable: you’ll specify a baseline request to ensure it schedules, but also a higher limit to handle peak demand. The tool’s reference table spells out these tradeoffs and explains why BestEffort pods frequently dissapears first as the cluster becomes tight.
Another piece of the puzzle that many teams find out too late are namespace quotas. Even though you may have lots of node capacity, if your namespace runs out of memory or CPU quota, then no new replicas will be started. Fast nodes don’t help when you’re out of budget for administration. Before you go ahead with horizontal scaling, the calculator adds together your current number of replicas against all relevant quotas and shows you a reality check. That way, you avoid the embarrassment of having a deployment stuck because you forgot to ask your platform team for more quota resources.
VPA’s vertical pod autoscalers‘ recommendations may seem odd. “Why should I listen to you when my gut tells me otherwise?” You shouldn’t blindly follow VPA, it doesn’t have insight into your business’s upcoming marketing campaigns or seasonal traffic booms that you as a human operator do. That said, it knows how much you’ve historically needed from each service, and makes an educated guess at what the best request would be. Don’t ignore VPA’s data, but don’t follow it mindlessly either. Compare the VPA suggestion with your estimated burst using the calculator. For example, if VPA recommends 200 millicores and you’re aware that a batch job will spike up to 500, go with what you know about workload’s future requirements.
The presets represent patterns in the real world. A Java service has different memory characteristics than a Go worker, largely due to garbage collection behavior and heap management. You might also want to set strict memory caps on a Redis sidecar to prevent starving your primary application. The right preset will adjust the underlying safety margin and burst factor assumptions and get you a sensible place to start based off your tech stack. It is not magic, but it takes away bias by starting all calculations at zero.
Managing resources is all about the balance of reliability vs. Efficiency. Put too many pods on a node, and you’ll run out of memory and starve them. But put fewer than necessary, and you’re wasting cash. The calculator spits back a reasonable guess given your inputs. Still, there’s no substitute for seeing if it works in production. Look at throttling metrics post-deploy. Monitor for restarted containers due to memory constraints. As your app matures, tweak those numbers (what feels good in staging rarely holds up in prod). Keep the dial handy.
These are things you set once, right? Wrong! These are knobs that you tune. It is a feedback loop of config to telemetry. Begin with reasonable guesses, test those against production traffic, and repeat. You don’t want to be 100% efficient, you would of wanted to be predictably stable. Ground your requests in the real world and keep your limits protected from chaos. Your cluster will remain up when it matters.