Kubernetes Node Capacity Calculator
Estimate allocatable CPU and memory, pods per node, cluster-wide pod capacity, and the scheduling bottleneck after kube reservations, eviction thresholds, DaemonSet overhead, and HA buffer.
Total logical CPU advertised by each worker node.
Installed memory per worker node in GiB.
CPU held for kubelet, container runtime, and node agents.
Memory held for Kubernetes components.
CPU held for OS services, logging, and host processes.
Memory held for the host OS and background agents.
Hard or practical memory pressure floor not assigned to pods.
Kubelet, CNI, or managed Kubernetes pod density cap.
Use requests, not observed CPU usage, for scheduling fit.
Average requested memory per workload pod.
Per-node CPU requests from CNI, CSI, log, security, and monitor pods.
Per-node memory requests from DaemonSet pods.
Capacity held back for rollouts, failures, and rescheduling.
Number of nodes in this homogeneous pool.
Changes the recommendation wording, not the core scheduler math.
Useful for what-if planning when CPU requests are conservative.
Node CPU after kube/system reserved and DaemonSet requests.
Node memory after reservations, eviction floor, and DaemonSets.
Cluster capacity held back for failures and rolling updates.
Homogeneous node count used for cluster-wide capacity.
| Node Size | Raw Resources | Typical Reserved | DaemonSet Overhead | Practical Allocatable |
|---|---|---|---|---|
| Small worker | 2 vCPU / 8 GiB | 350m / 1.2 GiB | 250m / 512 MiB | 1.4 vCPU / 6.3 GiB |
| General worker | 4 vCPU / 16 GiB | 500m / 1.8 GiB | 350m / 768 MiB | 3.1 vCPU / 13.5 GiB |
| Production worker | 8 vCPU / 32 GiB | 600m / 2.8 GiB | 450m / 1 GiB | 6.9 vCPU / 28.2 GiB |
| Memory worker | 8 vCPU / 64 GiB | 700m / 4 GiB | 450m / 1.2 GiB | 6.9 vCPU / 58.1 GiB |
| Compute worker | 16 vCPU / 64 GiB | 1200m / 4.5 GiB | 650m / 1.4 GiB | 14.1 vCPU / 57.3 GiB |
| Instance Profile | Raw Size | Best Fit | Capacity Signal | Watch Out |
|---|---|---|---|---|
| 2 vCPU / 8 GiB | Small general | Dev, edge, light services | Memory usually wins for tiny pods | DaemonSets consume a large share. |
| 4 vCPU / 16 GiB | Balanced small | Home lab apps and staging | Good density for 250m pods | Max pods may matter with tiny sidecars. |
| 8 vCPU / 32 GiB | Balanced medium | Production web/API pools | Strong default for mixed workloads | Track rollout surge and zone spread. |
| 8 vCPU / 64 GiB | Memory optimized | Java, databases, observability | RAM-heavy pods fit cleaner | CPU can bottleneck first. |
| 16 vCPU / 64 GiB | Compute medium | CI, workers, video, batch | High CPU pod density | Large nodes increase failure blast radius. |
| 32 vCPU / 128 GiB | Large compute | Dense services, data processing | Efficient for big steady pools | Pod and ENI/IP caps may arrive early. |
CPU Fit
Schedulable pods by CPU equals usable millicores divided by average pod CPU request, optionally adjusted by the overcommit factor.
Memory Fit
Schedulable pods by memory equals usable MiB divided by pod memory request. Memory overcommit is risky because OOM kills are disruptive.
Pod Cap Fit
The kubelet or managed CNI pod cap can bottleneck very small pods even when CPU and memory still have room.
| Planning Item | Typical Range | Use In Calculator | Practical Note |
|---|---|---|---|
| Kube reserved CPU | 100m to 1500m | Kube reserved CPU | Scale with node size and managed platform defaults. |
| System reserved RAM | 0.5 to 4 GiB | System reserved RAM | Leave room for OS, journald, runtime, and agents. |
| Eviction hard memory | 0.5 to 2 GiB | Eviction threshold RAM | Prevents scheduling into memory pressure. |
| DaemonSet overhead | 250m to 1500m | DaemonSet CPU/RAM | Add CNI, CSI, log shipper, security, and monitoring. |
| HA buffer | 20% to 50% | HA buffer | Use higher values for small clusters and zone failover. |
On paper, you’ve set up what appears to be a perfectly healthy cluster; then you watch as your routine deployment chokes because one of your nodes simply couldn’t fit another pod. You’re sure the math adds up…until you remember that there’s an invisible tax each Kubernetes worker node has to pay just to remain online. Most often this isn’t about the application logic, but the gap between total hardware specs and what remains for your workloads.
After plugging in your reservation policies and raw hardware specs, it spit out the answer for you in the calculator above. No more guesswork about whether you have as much headroom as you think you do.
Why You Need Extra Space in Your Cluster
Start with the things that use up your nodes’ capacity before any of your container are launched. The underlying operating system and the kubelet each requires some amount of CPU and memory. You cannot reduce these amounts, even if things get difficult. Rather, they’re overhead that keeps your node running healthily, manages the container runtime, and accounts for monitoring/logging agents or whatever else you might run. Otherwise, your scheduler will gleefully place pods in a non-existent space, quickly exhausting your resources and eventually evicting pod.
There’s also the DaemonSet layer. The fixed cost per node. No matter what number of application pods you deploy, you’re going to run security monitors, log shippers, CSI drivers and network plugins on each and every worker. That scale linearly with your cluster, not with the demand of your workloads. Scaling out doesn’t increase efficiency like it might in a traditional virtualized environment. Every time you scale out, you pay that tax.
The tool take that into account. This lets you see exactly how much usable capacity you have left once those mandatory residents has taken their share.
Kubernetes doesn’t overcommit memory the way it does CPU (though I should note that’s usually a forgiving approach). When a node is short on RAM, it will kill off pods until it survives. It won’t sit there and whine about it after the next billing cycle. That’s why it’s so important to establish a sane eviction threshold.
It’s best practice to give yourself a safety floor below which the scheduler shouldn’t fill your nodes completely. Give yourself some wiggle room so background jobs don’t cause a sudden surge in traffic or temporary memory bloat during container restarts or deployments, otherwise they will trigger an OOM killer event.
When you are thinking through high availability, it’s not just about steady state performance; it’s about how well your system cope with failures. And the high availability buffer is that extra capacity that you have set aside in case a node fails, and you want its workload shifted elsewhere without bringing down the rest of the service. For mature production systems, a 20% buffer is normal; some clusters may require a 50% buffer to survive large outages (e.g., if they span multiple zones). At a glance it looks wasteful. That unused capacity! But then a rack goes dark… and that unused capacity is the difference between quiet failover vs. Pager storm.
Another surprise: there’s a pod density cap lurking in your environment. The kubelet or some other component of your network plugin may be enforcing a hard limit on how many pods can coexist at any given time. This will bite you most often for those tiny resource footprint microservices. Technically you might be able to squeeze out hundreds of little services… but it’s not efficient for the cluster infrastructure to support hundreds of containers and network interfaces. This is a limit of the platform itself, not the hardware.
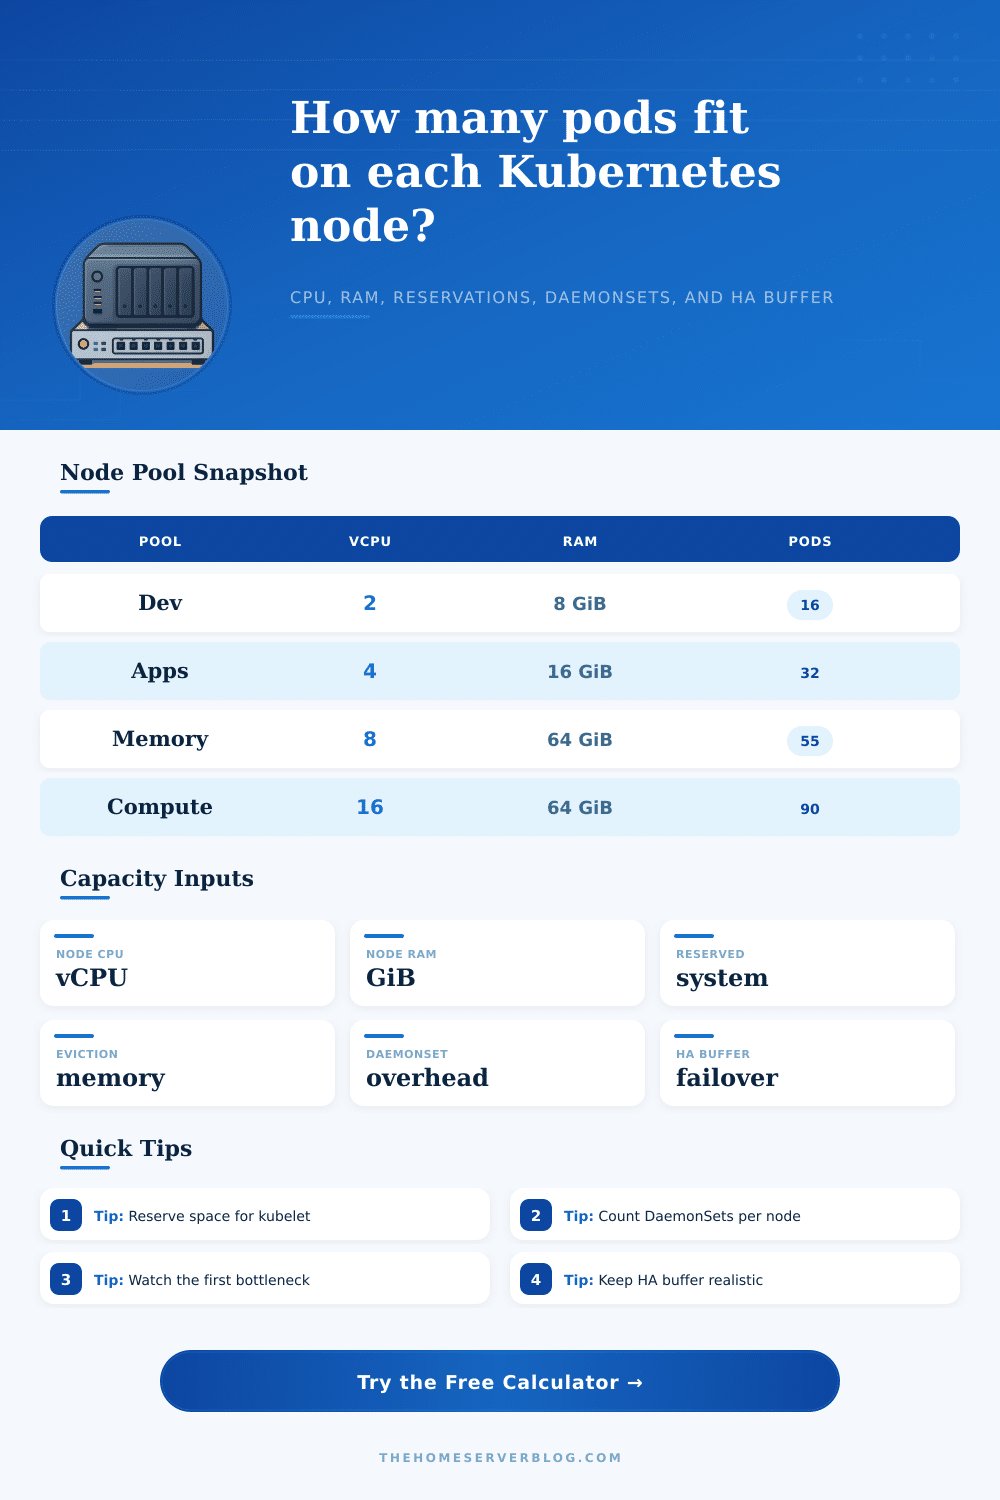
This avoids those trade-offs altogether, but it does so by partitioning your workloads across their own node pools. A database that’s churning through memory and a job running long batch processes don’t get along in the same space. By keeping them separate, you can provision each pool according to its specific bottleneck and not needlessly oversize one resource to make up for the other. To show this, the page’s reference tables walk through how various instance types perform given common reservations schemes… You can immediately see how compute heavy nodes differs from memory optimized ones when taking overhead into account.
But in the end, capacity planning isn’t really about optimizing for use; it’s about predicting failures and having sufficient slack to handle them without buying silence. If you know you’ll never have all your allocated resources (and you will), then you stop squabbling with your scheduler and begin building to match. That gap isn’t waste, it’s the cost of leaving the lights on during busy periods.