Circuit Breaker Threshold Calculator
Estimate service breaker settings from request volume, failure behavior, rolling windows, slow calls, cooldown time, baseline error rate, and SLO target.
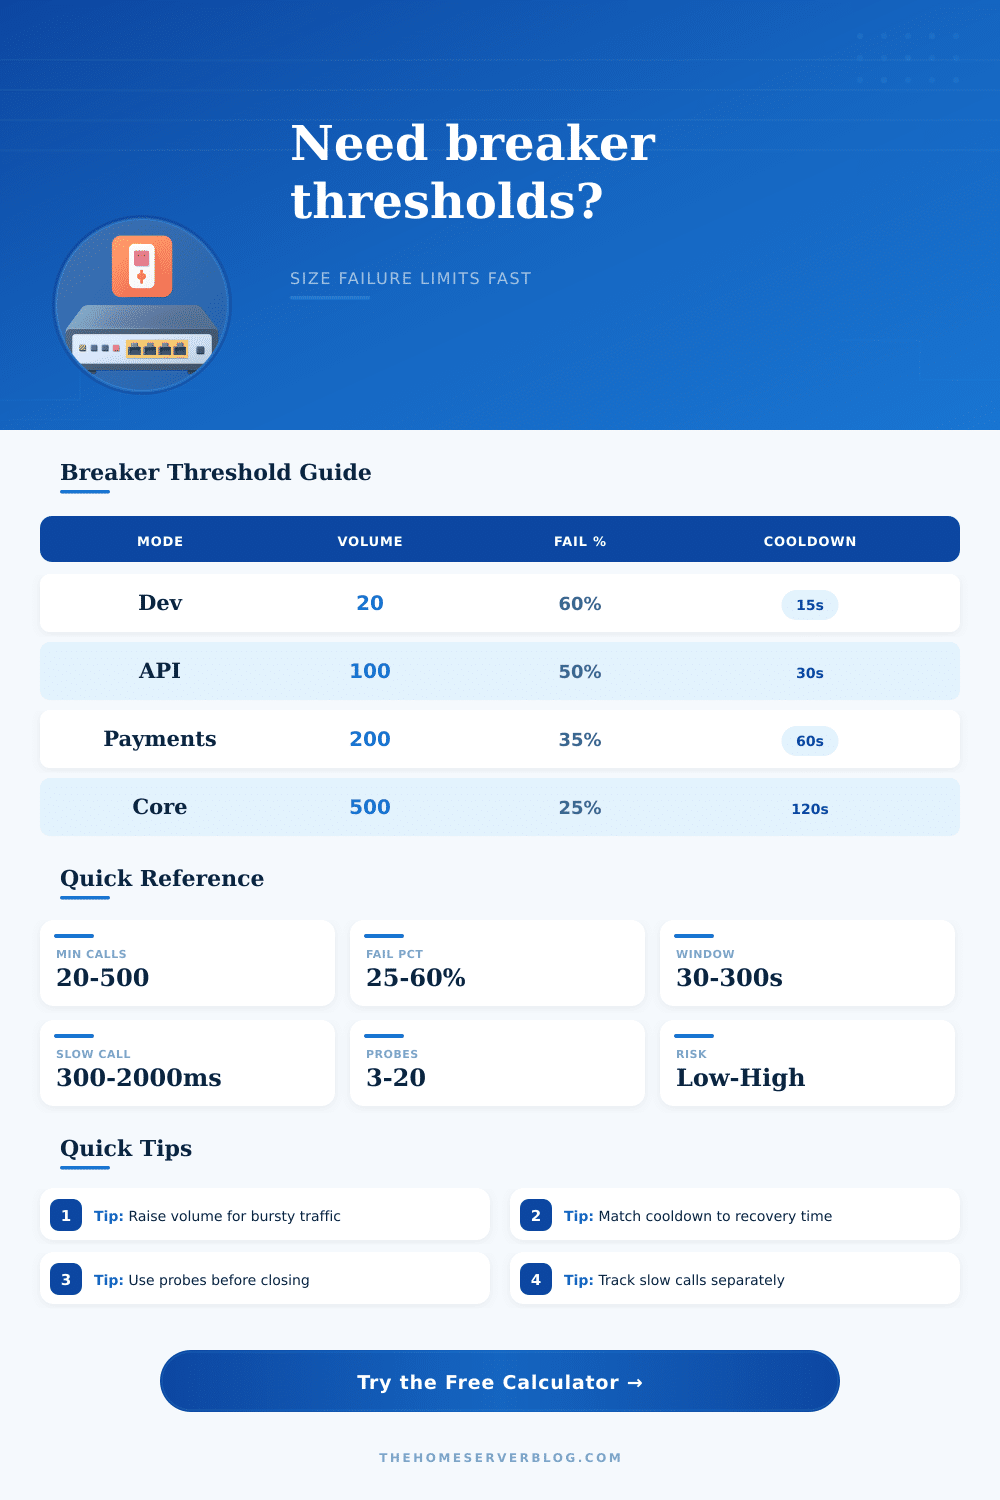
| Service type | Request gate | Failure threshold | Window | Cooldown |
|---|---|---|---|---|
| Local dev dependency | 20 to 50 calls | 60% or 15 failures | 30 to 60 sec | 10 to 20 sec |
| Home lab API | 50 to 100 calls | 50% or 25 failures | 60 to 120 sec | 20 to 45 sec |
| Customer-facing API | 100 to 300 calls | 35% to 50% | 60 to 180 sec | 30 to 90 sec |
| Critical shared service | 300 to 1000 calls | 20% to 35% | 120 to 300 sec | 60 to 180 sec |
| Low-volume scheduled worker | 10 to 30 calls | Count based | 300 to 900 sec | 60 to 300 sec |
| Mode | Best for | Trip signal | Watch-out |
|---|---|---|---|
| Failure-rate | Moderate or high traffic services | Failure percentage after minimum call gate | Can misread small samples without a volume gate |
| Failure-count | Batch jobs and low-volume integrations | Absolute number of failed calls | Needs a sensible rolling window length |
| Slow-call | Dependencies that degrade before failing | Slow-call percentage above latency threshold | Requires realistic latency baselines |
| Hybrid | Critical APIs with latency and error SLOs | Failure-rate or slow-call threshold, whichever triggers first | Needs careful alert routing to avoid noise |
Every microservice architecture has a single point of failure that keeps engineers awake at night (typicaly not the code), but a dependency somewhere else. If a downstream database slows down, if an external API starts timing out, your otherwise healthy service will retry requests against a broken target. That leads to a chain reaction of failures until your entire system go down. The circuit breaker pattern prevents that kind of cascade by stopping it before it’s too late.
But setting up a circuit breaker take some careful tuning to find the right balance between sensitivity and stability. You want the breaker to trip quickly enough to avoid wasting resources, yet slowly enough to not shut off traffic in the case of a small hiccup. With the above calculator, we does that math for you given your particular rate of errors and traffic patterns.
How to Set Up Your Circuit Breaker
At the center of every circuit breaker setup is the question: how many times do I want to trip? When do failures cross the line? Many engineers are overcautious here; they start with a trip threshold that’s lower then it ought to be. If you set the trip line at three percent when your base-line error rate is two percent, you will surely get false positives. The tool will help you determine the proper margin based off your Service Level Objective targets. Enter the number of requests you expect to handle and how many of those has failed so far. It’ll tell you where the trip line really belong.
The gates are volume gates. People often forget these, but they is very important for accuracy. A single failed call out of ten request represents a 100 percent failure rate. And if your breaker trips with this then your service is now useless for seconds. To ensure this doesn’t happen, the calculator requires a certain number of calls to occur before it will even consider tripping the breaker. This ensures that no noise will trip the safeguards unnecesarily. There has to be statistical significance to know something’s wrong and not a blip.
Cooldowns are also important to consider when configuring. This is time given for the downstream service to heal after opening the breaker and stopping all traffic sent by it. Too long a cooldown, and we wait needlessly with our users while the service could of recovered. If the cooldown is too short, we open the breaker again in a loop called flapping. This means we rush back into the same failure we just came from.
The page’s reference table shows the varying cool-down times required by various types of services. Higher consequence of failure require a longer pause: a payment gateway needs longer down-time compared to a media server. This all hinges on the half-open state acting as a safety valve. Once the cooldown period is over, the breaker will open just enough (a few probe requests) to see if the downstream service has recovered. It does that by sending out some probes, which, if successful, causes the circuit to close and restore normal traffic flow. But if not, it reopens. This is a tradeoff between how quickly you want things verified versus how tolerant you are to risk. The more probes, the slower everything recovers but the more certain you know for sure the problem is fixed. Less means quicker, but less confident.
Keep in mind that traffic shape impacts your thinking on these limits too. Aggressive triggers with narrow windows work best on steady traffic. Wide windows are good for smoothing out bursty traffic. In this case, a spike that looks like a failure is simply normal variation. Failing to do this will cause breakers to trip at times of peak load, which is when you least want them to. It can even cause them not to trip because the high volume dilutes the failure rate.
In conclusion, a circuit breaker is insurance for dependency failure. You pay for this insurance in terms of a little latency overhead and some more complexity. But its purpose isn’t perfection, its purpose is resilience. Tune your thresholds to reflect your real world recovery times and error budgets so that when failures occur, they stay contained events instead of being systemic crashes. If you don’t know what these should be, start with the presets defaults. As you learn about your particular set of services under load, tune accordingly. A little bit of config investment, and when things inevitably go wrong, it pays off.