Message Queue Depth Calculator
Estimate burst backlog, stored bytes, drain time, and oldest-message risk for home lab services, workers, webhooks, and event pipelines.
⚡Queue presets
📊Queue load inputs
🖥Queue reference cards
📘Queue sizing reference tables
| Signal | What it means | Watch when | Common response |
|---|---|---|---|
| Queue depth | Messages ready or delayed in the queue | Depth rises faster than consumers drain | Add workers, reduce producers, or shard queues |
| Oldest age | Time since the oldest waiting message arrived | Age approaches customer or job SLA | Scale consumers before retention becomes a risk |
| Retry rate | Share of messages that return for another attempt | Transient failures become steady load | Use backoff, idempotency, and DLQ thresholds |
| Visibility timeout | Lock window for in-flight processing | Jobs run longer than the timeout | Increase timeout or heartbeat long jobs |
| Retention limit | Maximum time the broker keeps a message | Drain time plus oldest age nears TTL | Raise retention or reduce backlog immediately |
| Workload pattern | Typical burst | Depth planning rule | Operational note |
|---|---|---|---|
| Webhook receiver | Short spikes after external events | Size for peak producer rate minus safe consumers | Protect the endpoint with fast enqueue and retries |
| Batch import | Large predictable windows | Use run size plus retry multiplier | Schedule consumers before the batch starts |
| Media processing | Slow consumers and large messages | Plan storage bytes as carefully as message count | Store blobs outside the queue when possible |
| Telemetry stream | Many small messages per second | Watch partition or shard throughput limits | Aggregate at the edge if lag grows |
| Notification fanout | High retry exposure | Model retries as added producer traffic | Use exponential backoff and provider limits |
⚙Broker comparison grid
| Broker style | Depth metric | Retention behavior | Best fit |
|---|---|---|---|
| Amazon SQS style | Approximate visible messages and oldest age | Queue retention with visibility timeout redelivery | Decoupled jobs, webhooks, async workflows |
| RabbitMQ style | Ready plus unacked messages per queue | TTL, durable queues, and broker disk pressure | Routing, work queues, request fanout |
| Kafka style | Consumer lag by topic partition | Log retention by time or size | Streams, replay, analytics pipelines |
| Redis streams | Pending entries and stream length | Trim policies and memory limits | Low-latency workers and compact event logs |
| NATS JetStream | Consumer lag and pending acknowledgements | Stream limits by age, bytes, and message count | Fast services, edge sync, command pipelines |
| Generic queue | Ready depth, in-flight count, and age | TTL or cleanup policy depends on the platform | Capacity modeling before platform details are final |
💡Queue planning tips
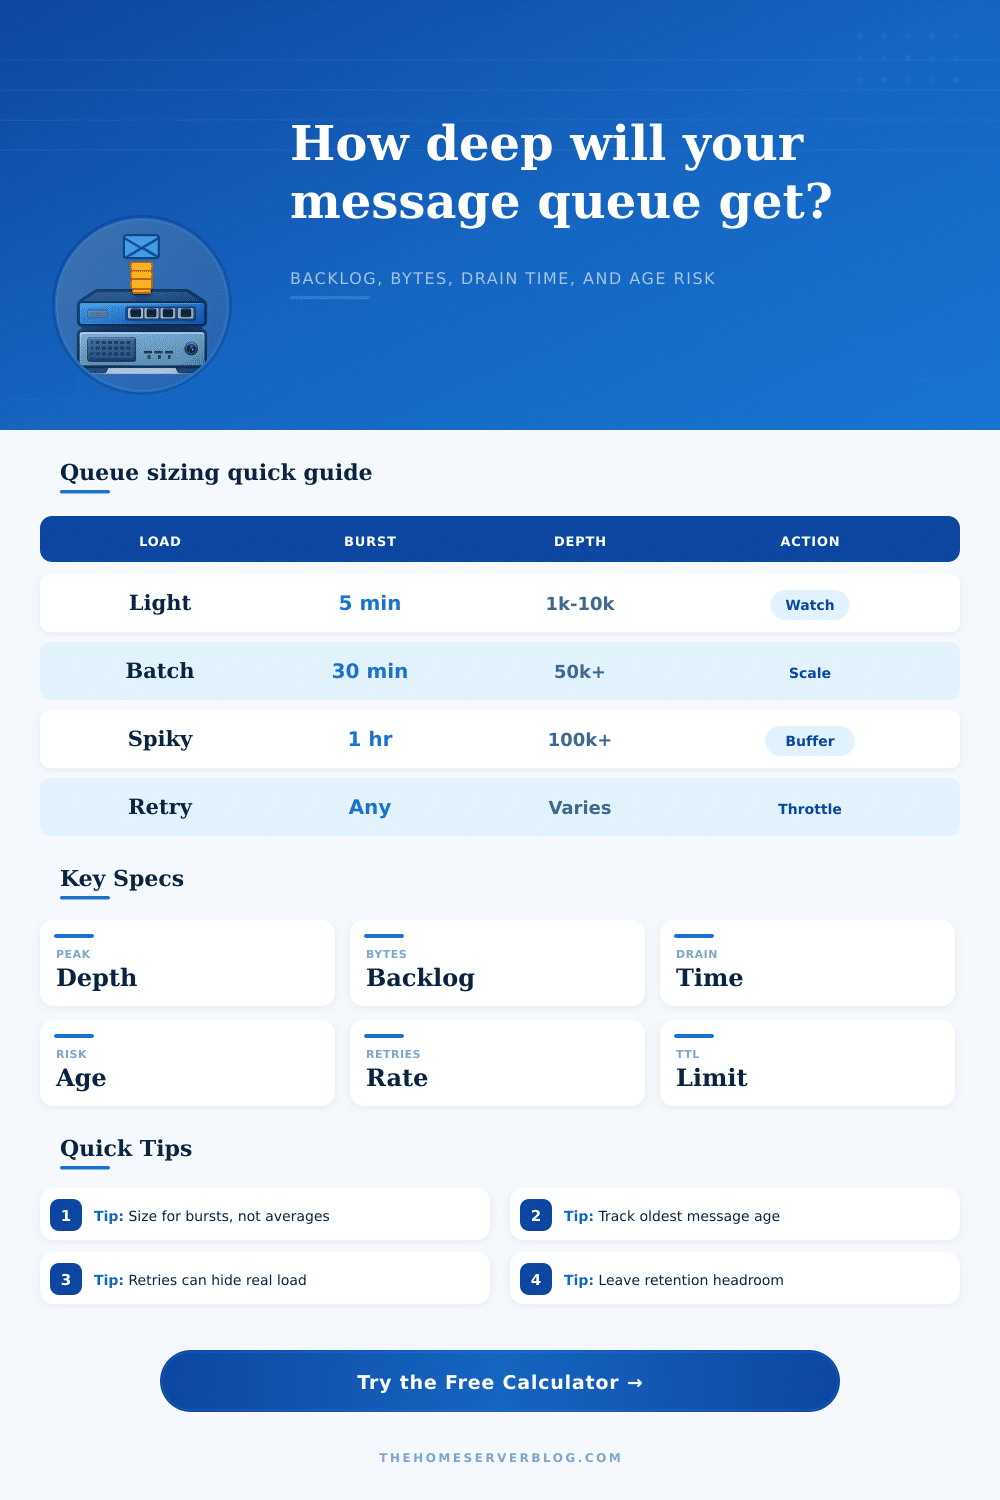
There’s a certain type of panic you feel when you realize your app is choking on its own data. Your users sit idle as queue depth creeps up on dashboard. Typically this isn’t due to too much volume overall: it happens during short, sharp bursts when more traffic arrives than can be processed. A backlog forms that take hours to drain.
Average load is easy to predict, so most teams size their infrastructure accordingly. Averages lie. They smooth out the spikes. Until they’re gone and nothing remains to plan for.
How to Keep Your App Fast
With that input, consumer capacity, and producer rates, the calculator does the rest of math. No more guesswork about what amount of traffic annoys your system vs. It breaks it.
What’s the effective load? It is not the raw number of messages coming in. What matter is the hidden weight on the queue: retries. If three percent of your messages fail and get retried, then they come back as fresh work for the same overworked consumers. They enter a feedback loop. More failures mean more load. This results in more latency which results in more failures. And it all spirals quickly, because it’s such a little thing.
Deciding how many consumers to use means understanding that capacity isn’t about the number of workers; it’s a rate (i.e., a worker doing 1000 things per second is better than one worker doing 10 things per second). The tool let you determine the break-even point at which your total throughput equals or exceeds your input for some period of a burst. As long as the rate remains positive, the queue depth increase with each passing second. Eventually the retention limit is reached and you begin dropping data altogether.
Because people think in terms of message count instead of time, they frequently miscalculate. Having one hundred thousand idle messages is much worse than having ten thousand waiting to be worked on right now, if those first messages now have expired session tokens or stale telemetry data. Because broker behavior differ (some will auto-age messages out, some don’t and just hang on to them until they run out of space), you can’t think of all queues as one big homogenous bucket. The reference table describes each style of broker and explains how their differences affects the retention policy. For example, if you’re using an aging system, a long drain time lead to lost data before it’s ever read.
That’s why visibility timeout setting is so important. That’s the length of time a message remains held during processing. Set it too short and slow jobs gets requeued too early, which duplicates effort. Set it too long and when your consumer crashes its messages sit there in limbo for hours. Knowing precisely how long your slowest job takes under load helps you find that sweet spot.
But then there’s the creeping cost of storing things. Messages aren’t free, they have actualy weight, and we tend to forget that. A million small JSON payloads don’t sound like much but what if they end up consuming megabytes of disk or broker memory during a peak event? Sending large blobs to the queue is all-but-always a bad idea. Instead you send a key referring to it stored elsewhere. The queue remains lean and fast; heavy-lifting happen on object storage.
The calculator shows you how many bytes your backlog represents, so you know whether you’re about to run out of memory and trigger an alarm. In short: it’s all about juggling the limits on both space and time. You want the queue to be deep enough to handle spikes but not so deep that anything spends an unacceptably long time waiting. It’s about creating a buffer between your infrastructure and your users’ experiences that shields them from transient failure but doesn’t turn into a parking lot for old data.
When things go wrong it’s less important how much is in there than how fast it moves. You monitor the total count and also monitor age of the oldest message with equal care.