Batch Processing Time Calculator
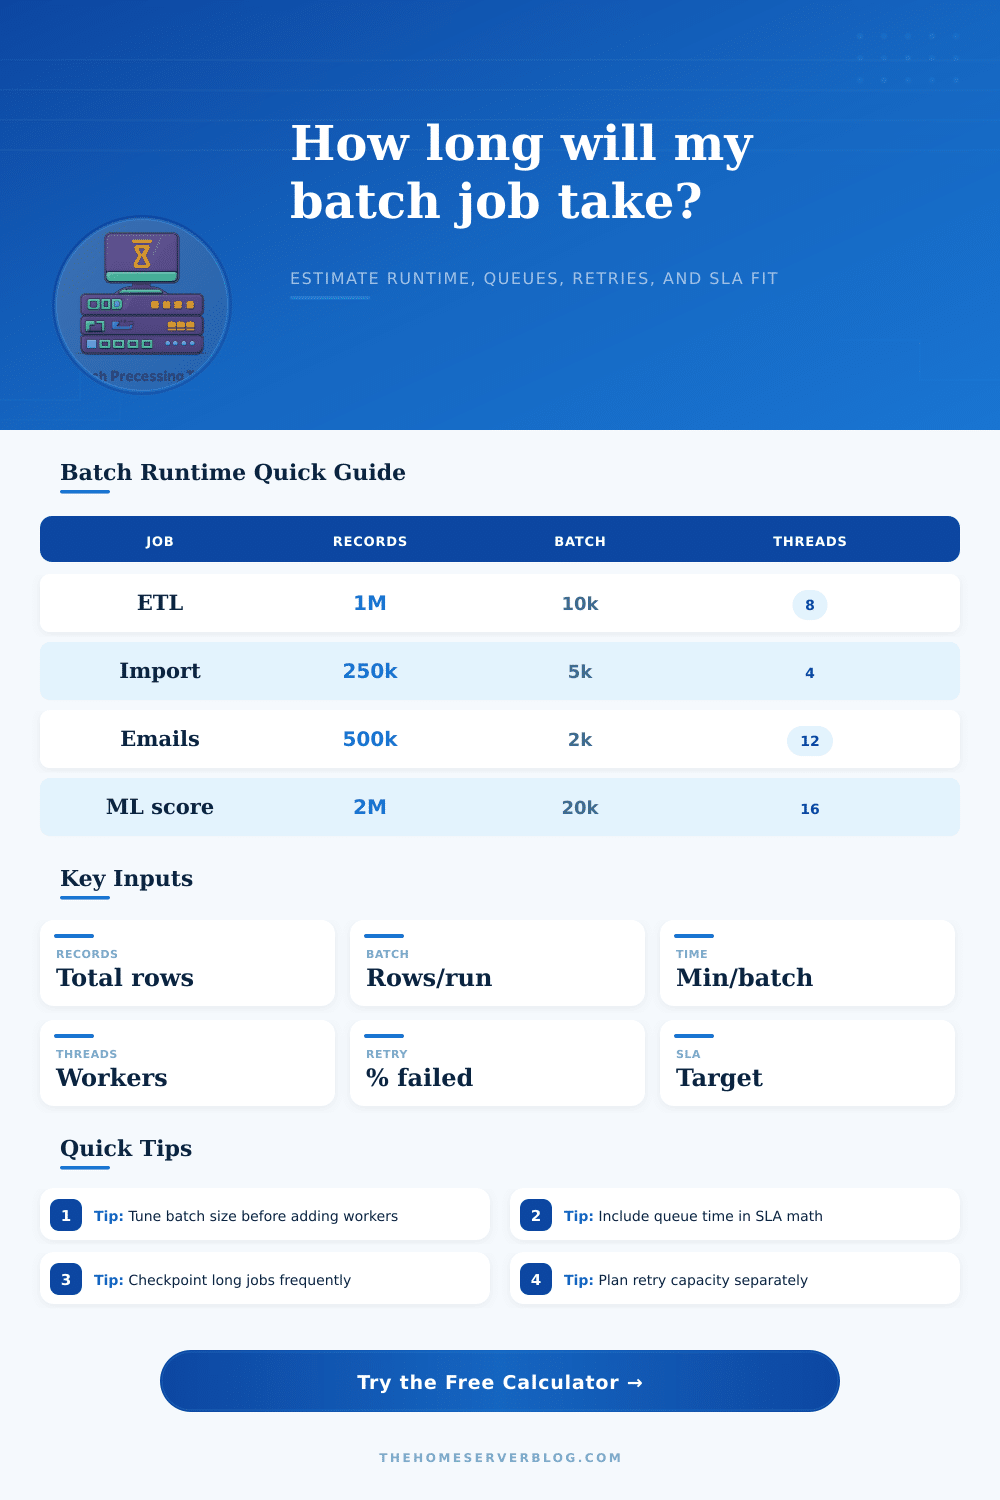
Plan batch job duration from records, batch size, per-batch runtime, worker threads, setup time, retries, checkpoint pauses, queue wait, and SLA target.
1 Choose a Batch Job Preset
2 Enter Job Parameters
Runtime Breakdown
SLA and Capacity
3 Worker and Queue Comparison Grid
4 Batch Job Planning Cards
Batch Size
Larger batches reduce scheduling overhead but increase rollback cost, memory pressure, lock duration, and noisy-neighbor impact.
Worker Count
Parallelism helps until the bottleneck moves to database locks, API rate limits, disk IO, network throughput, or shared queues.
Retries
Retry overhead should be budgeted separately because failed batches often cluster around bad records, throttling, or downstream outages.
Checkpoints
Checkpointing adds pauses, but it limits rework after interruption and makes long-running recovery less painful.
5 Reference Tables
| Workload | Typical Batch Size | Runtime Driver | Planning Note |
|---|---|---|---|
| Database ETL | 5,000 to 50,000 records | SQL time, indexes, commits | Watch transaction logs, lock waits, and checkpoint duration. |
| API enrichment | 100 to 5,000 records | Remote latency and limits | Keep retries below provider throttling windows. |
| Email or notification send | 500 to 10,000 recipients | Provider throughput | Separate send queue from rendering or personalization work. |
| File conversion | 10 to 1,000 files | CPU and storage IO | Measure per-file variance and reserve workers for long tails. |
| Search reindex | 1,000 to 25,000 documents | Indexer ingest rate | Throttle writes to protect live query latency. |
| Analytics rollup | 10,000 to 250,000 events | Scan size and grouping | Pre-partition by date, tenant, or shard for better recovery. |
| Retry Rate | Meaning | Operational Risk | Suggested Action |
|---|---|---|---|
| 0% to 1% | Clean run | Low | Track outliers and preserve normal checkpoint cadence. |
| 1% to 5% | Expected transient failures | Moderate | Confirm retry queues do not hide SLA misses. |
| 5% to 15% | Meaningful rework | High | Investigate bad inputs, throttling, memory pressure, or locks. |
| 15%+ | Unstable workload | Very high | Reduce batch size, isolate poison records, and add circuit breakers. |
| Parallel Threads | Best Fit | Common Bottleneck | Practical Limit |
|---|---|---|---|
| 1 to 2 | Small imports, fragile APIs | Queue delay | Simple and predictable but slow for high volume. |
| 4 to 8 | Nightly business jobs | Database commits | Good default for balanced home lab or SMB servers. |
| 12 to 24 | Large event or document processing | CPU, IO, rate limits | Needs monitoring and backpressure. |
| 32+ | Distributed worker pools | Coordination overhead | Requires sharding, idempotency, and queue depth controls. |
6 Batch Runtime Tips
There’s a unique type of anxiety when running batch jobs in production. It’s midnight, the cron fires up, you open your window, stare at your dashboard, and wait for something that seems so innocuous to get done on schedule. Reality intrudes with delays, retries, and latencies from queues that you didn’t factor into your quick math, and suddenly batch processing doesn’t seem quite so simple.
Once you plug in your worker limits and your record counts, the calculator does most of the work, but it’s knowing why different inputs will change your runtime by hours that really save your SLA. People’s mistake here (the first trap) is underestimating time needed for setup/teardown. When we think about the time needed to process one batch of data, we forget the minutes of loading configuration files, setting up connections, tearing down resources afterwards. These seem insignificant … until you start adding them together over hundreds of little batches, and the extra work build up. If you split a million records into really tiny chunks then your scheduler will spend most of its time coordinating rather than processing.
Why Batch Jobs Take Longer Than You Think
This is why the page has all those charts showing that workload type determines the ideal batch size. The take-away isn’t so much about numbers as it is about the trade-offs. Bigger batches has better throughput-per-worker and less scheduling noise, but they mean more memory pressure and a painful rollout if something fails late in the run.
If you have enough infrastructure to support parallelism then that helps. However, your infrastructure may not scale indefinitely. Eventually, as you bump into API rate limits or database locks, adding more workers will no longer add value. In fact, these extra workers now fight each other for a finite number of resources. This is where you’ll see diminishing returns.
The tool asks how many parallel threads you can run so you can observe those diminishing returns in advance. It makes you confront what’s really limiting your system, such as I/O constraints. Or it is computational power? Chances are most systems is I/O bound, and throwing more CPU at it won’t help much (unless you improve network latency or disk access).
And then there’s retry. We all hope it doesn’t occur, but we have to account for it in any case. A handful of failing batches can multiply your overall runtime. It becomes a serious problem when they run sequentially after the main one completes or block the main queue. The calculator shows retry overhead so you can tell exactly how many hours poor data or transient errors cost you. When the retry rate rises past five percent, it’s not noise anymore, you’ve probably got some kind of memory leak or throttling issue, and fixing that will generaly be more impactful than throwing additional workers at the problem.
Then there’s the added complication of checkpointing. Saving state when pausing helps avoid having to start over if interrupted, but each pause come at the cost of minutes of wall-clock time. To minimize recovery time while not making pauses dominate execution time, you want just-enough checkpoints. And you should of fine-tune this by adjusting the “checkpoint interval” slider to that sweet spot determined by how volatile your environment is.
And finally, never forget to account for queue wait time, scheduler delays don’t show up until they cause you to overrun the deadline. Aim for worst-case, measure p95 perf, and base your capacity decisions based off these numbers, not on your gut feeling.