MySQL memory planning
InnoDB Buffer Pool Calculator
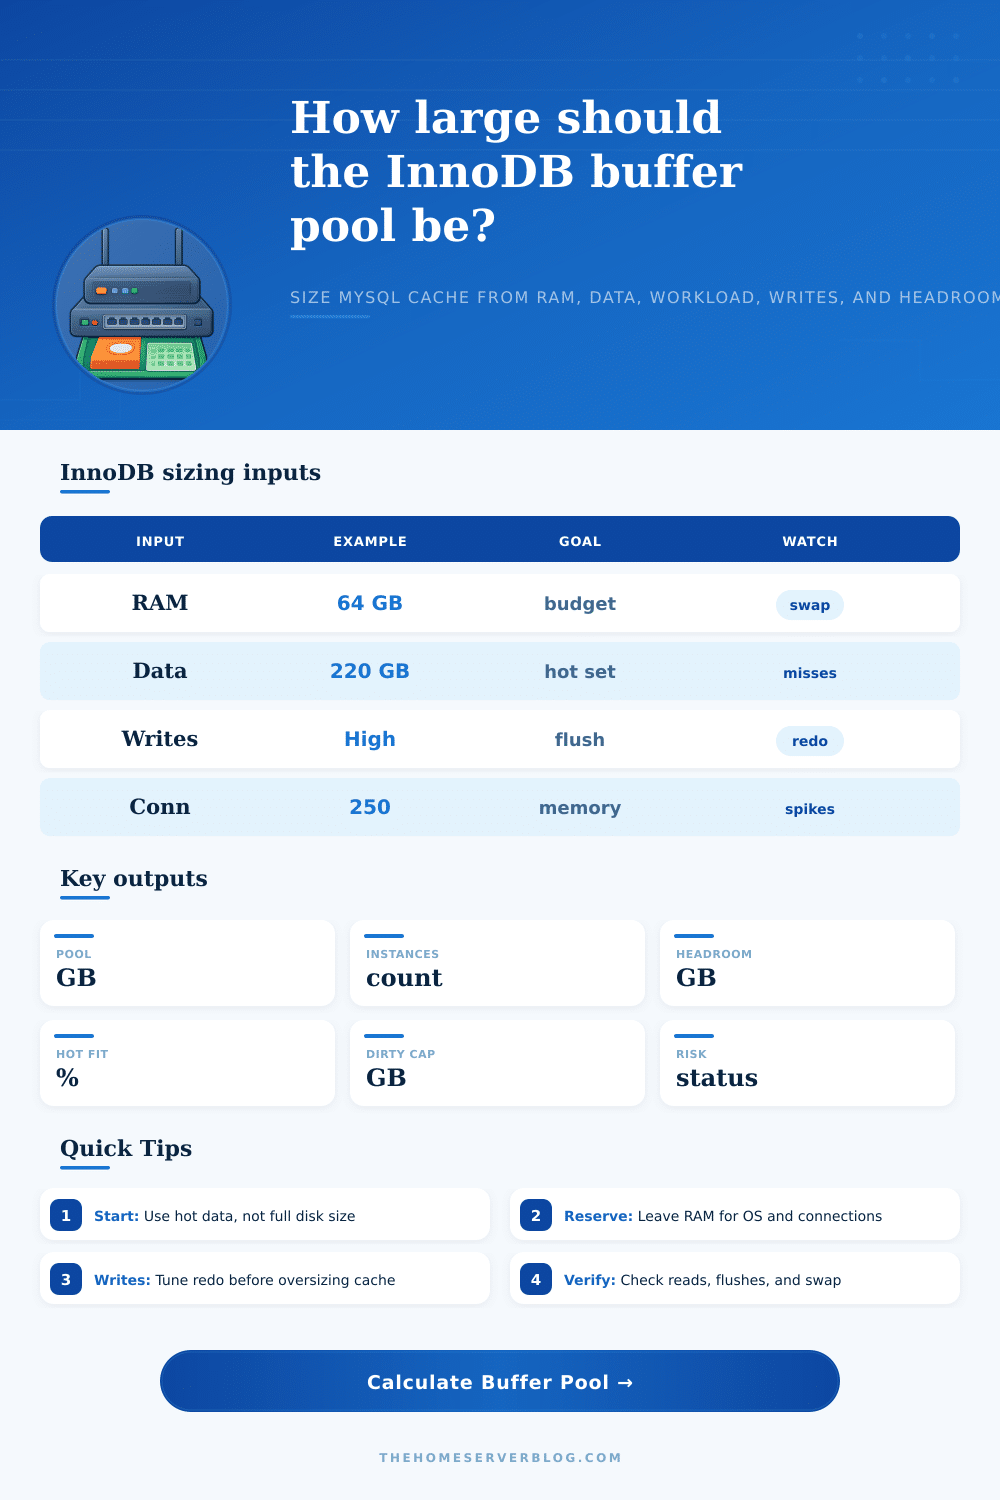
Estimate a practical innodb_buffer_pool_size from system RAM, data and index size, active working set, connection memory, OS reserve, redo log pressure, dirty page target, buffer pool instances, and workload type.
Memory breakdown
Fit and pressure
Dedicated MySQL
Often starts near 60% to 75% of RAM when connections and the OS reserve are modest.
Shared app host
Use a smaller pool because PHP, Java, Redis, search, backups, and agents compete for memory.
Container limit
Size from the cgroup or Docker memory limit, not the physical host RAM.
Hot set focus
The active data and indexes matter more than total database size for cache hit planning.
| InnoDB structure | Lives in buffer pool? | Why it matters | Sizing signal |
|---|---|---|---|
| Clustered primary index | Yes, as 16 KB pages | Every row access passes through the primary key B-tree pages. | Large hot rows increase the useful pool target. |
| Secondary indexes | Yes, as index pages | Lookup heavy apps can be index-cache bound even when table data is colder. | Count secondary index size in the data plus index input. |
| Change buffer | Uses buffer pool space | Can defer some secondary index changes on non-unique indexes. | Write heavy loads need headroom and redo capacity. |
| Adaptive hash index | Memory near buffer pool | Can speed repeated point lookups but adds memory and latch behavior. | Include a little other MySQL memory for it. |
| Undo and history | Pages can be cached | Long transactions retain old row versions and amplify page churn. | High history length means avoid shaving headroom too tightly. |
| Dirty pages | Yes, until flushed | Modified pages consume cache until checkpoint and page cleaner work catches up. | Dirty page target and redo pressure shape write risk. |
| Area | MySQL InnoDB | PostgreSQL | Practical takeaway |
|---|---|---|---|
| Main database cache | innodb_buffer_pool_size caches InnoDB data and index pages. | shared_buffers caches PostgreSQL pages. | MySQL usually gives more RAM directly to the engine cache. |
| OS page cache | Still useful for binlogs, temp files, non-InnoDB files, backups, and filesystem metadata. | Very important because PostgreSQL leans on OS cache for many read paths. | PostgreSQL often reserves a larger OS cache share. |
| Write pressure | Redo log size, dirty page percent, and page cleaner behavior affect stalls. | WAL, checkpoints, bgwriter, and dirty kernel pages affect stalls. | Cache size alone does not fix checkpoint pressure. |
| Per-connection memory | Sort, join, read, binlog, and temp buffers can spike with active sessions. | work_mem applies per sort/hash operation, not per server. | Concurrency estimates must be conservative for both engines. |
| Large memory | Buffer pool instances can reduce contention when pools are large. | Huge pages can help large shared_buffers deployments. | Large pools need startup, NUMA, and OS planning. |
| Typical starting point | Dedicated server often 60% to 75% RAM, lower when shared. | Often 20% to 35% RAM plus a healthy OS cache. | The right split depends on workload and storage behavior. |
| Workload | Pool target | Extra concern | First validation query |
|---|---|---|---|
| Small WordPress or CMS | Fit hot posts, options, users, and common indexes. | Plugin queries and PHP memory may dominate on shared hosts. | SHOW GLOBAL STATUS LIKE 'Innodb_buffer_pool_read%'; |
| Commerce checkout | Fit product, cart, order, and customer hot indexes. | Write bursts need redo and flush capacity. | SHOW ENGINE INNODB STATUS; |
| Read mostly API | Fit the most requested lookup and join pages. | A slightly larger pool can reduce storage latency sharply. | SHOW GLOBAL STATUS LIKE 'Innodb_buffer_pool_reads'; |
| Write heavy OLTP | Fit hot indexes but avoid starving background flushing. | Redo log pressure and dirty pages decide stall risk. | SHOW GLOBAL STATUS LIKE 'Innodb_os_log_written'; |
| Reporting replica | Leave room for temp tables and scan churn. | Full scans can evict OLTP hot pages on mixed servers. | Check Handler_read_rnd_next trends. |
| Time series ingest | Fit active partitions and primary write indexes. | Partition pruning and retention jobs matter. | Track dirty pages and log waits. |
my.cnf example
Set innodb_buffer_pool_size to the recommended GB value and set instances only when the pool is large enough for meaningful partitions.
Online resize
MySQL can resize the buffer pool online, but large changes still create churn. Schedule carefully on busy systems.
Redo first
If redo pressure is high, increasing redo log capacity and fixing slow flushes may help more than adding cache.
The same applies to database memory. My computer is feeling slow, so I’ll go out and get that large hard drive.” Then, after getting it, I realize nothing has changed. That’s an all-too-common error.
When looking at a 2 terabyte dataset, you figure, I better have a terabyte of RAM. Nope. Not even close. It isn’t about caching all of the stuff. It’s about caching what you touch every single minute.
How to Size Your Database Memory
InnoDB pages is kept in short-term memory, which is called the buffer pool. Data rows and index entries that being used by a process or query reside here. When a query can finds what it’s looking for in memory, it will return fast. Otherwise, it has to go all the way down to the disk. Even if the disk is lightning-fast NVMe storage, going there under load introduces latency.
You don’t want to overload your operating system or starve other apps of memory, but you do want the working set to be largely in memory, especially parts that are actively being worked on. This means more than just considering overall file size; it also involves examining how things is used over time.
How does it work? Typically, most admins begin with an estimate of RAM in their system. Deduct the kernel size plus connection overhead, filesystem cache, and whatever monitoring agents you use. Then you can assigns those bytes to the buffer pool.
If you’re running the MySQL database and WordPress on the same machine, you’ll need to adjust the percentages downward. The same applies to shared hosting environment. There are rules of thumb, like allocating 60 percent to 75 percent of total memory for a dedicated server; but they don’t take your particular situation into account.
With the calculator, you simply input your constraints, and it does the math for you. (That way, you don’t have to keep track of how many megabytes were set aside for temporary tables vs. It even considers the dirty page threshold. This prevents the cache from filling up so much that it stalls the background flushing mechanisms when there is write pressure.
Buffers consist of buffer pool instances. Most folks don’t think about these. With old MySQL versions, more instances help because they divide a big pool into smaller pieces, which reduces latch contention on multiple cores. Later versions does that internally better. So bigger (fewer) instances tend to work better now. Having too many instances for a small pool actualy adds overhead rather than helping. It will suggest how many instances based off the total size. That way each segment is large enough to be useful.
It’s consistent with best practice where simple configs are preferred except when working with pools well over hundreds of GB. This brings us back around to sizing this pool.
For instance, an aggressive cache works well for a read-heavy API where multiple lookups is hitting the same indexes. On the flip side, a time series application or write-heavy OLTP system has lots of modified pages flushing to disk. Having too large of a cache may impact checkpoint operations, causing log pressure to spike. Read-heavy versus write-heavy workloads have opposite trade-offs, and the reference table illustrates how they contrast with each other.
Knowing what kind of workload you’re running, i.e., knowing your bottlenecks (is it CPU contention or I/O wait?) tells you which lever to pull first. Think of the database as a dynamic set instead of a static repository. As it accept new queries, it adds new pages and ages out old ones from the cache. For the most part, this should keep read requests off the disk if your hot set can fit into the allocated space.
To confirm this, monitor status counters during peak hours. Low read ratios indicates your sizing is working. High ratios mean you either need more space, though this is only a temporary fix, or you are scanning too much cold data that could be improved. The latter case will usually yield higher returns then bumping up the memory limits.
The size of your buffer pool is a question of finding that sweet spot: enough to make everything run faster with memory (but not so much as to be fragile). That’s a balancing act between responsive and stable; how much do you need to prevent needless disk access vs. You also need to leave room for unexpected spikes in traffic.
Be conservative initially; watch your hit rates; tweak according to actual observed behavior, not hypothetical maxes. The DB will let you know what it wants if you’ll pay attention to the proper metrics. You should of monitored the performance more closely.