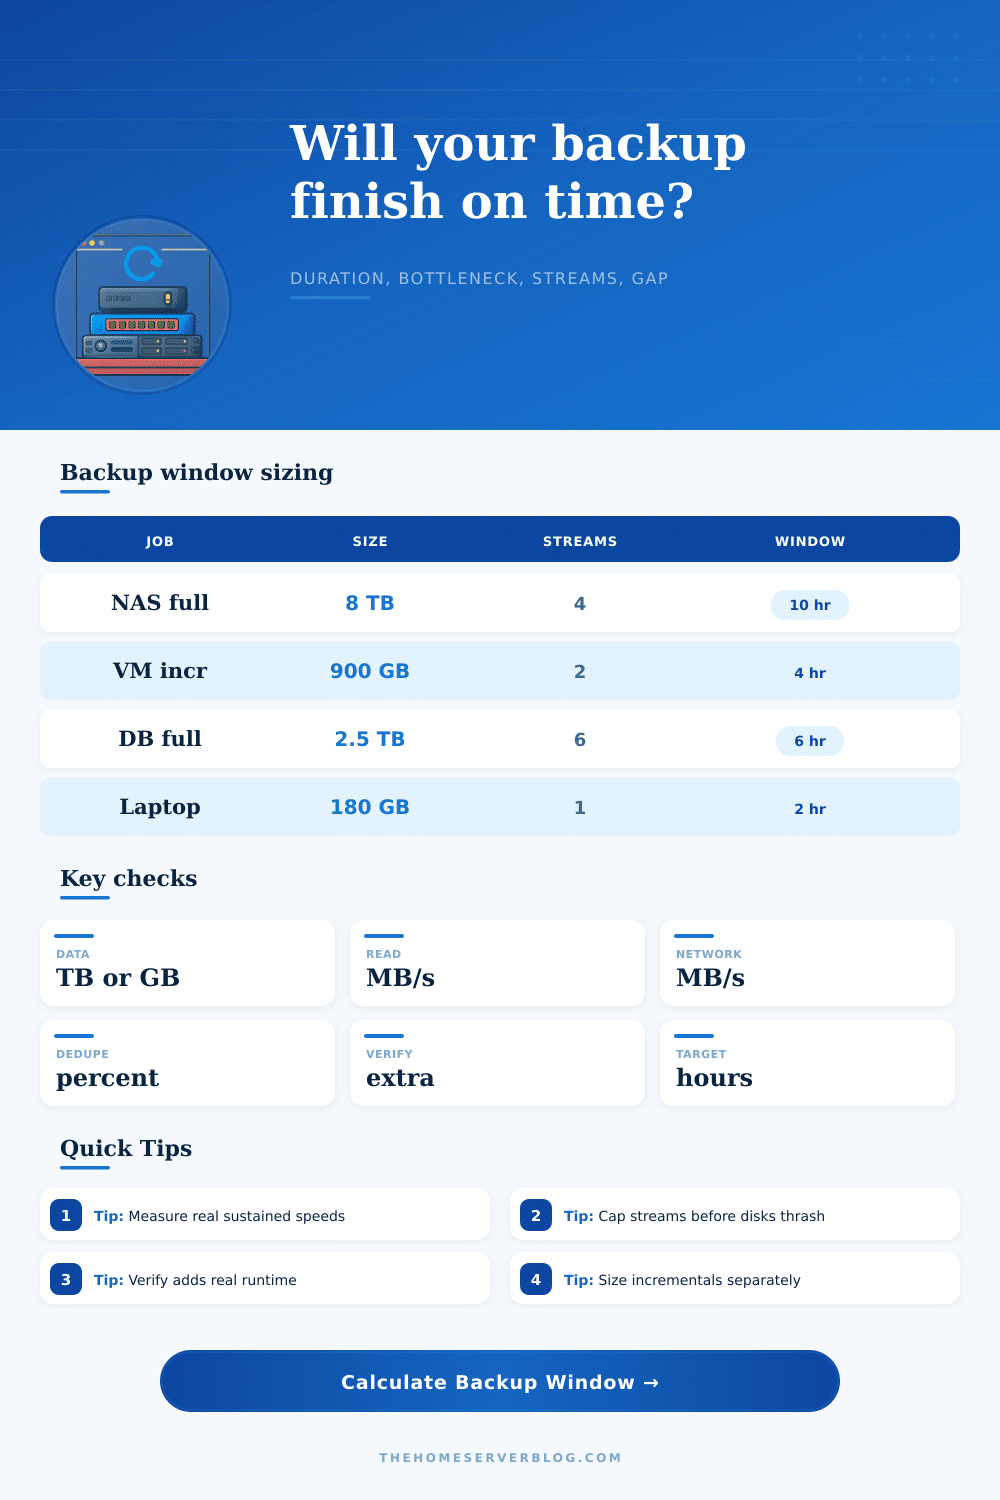
Backup Window Calculator
Estimate full or incremental backup runtime from data size, throughput, compression, dedupe, parallel streams, verification overhead, and your target window.
Backup Window Results
Use measured sustained speeds from backup logs when possible. Peak interface speed is usually higher than real backup throughput.
Full Backup
Best for: clear restore points. Highest data read and transfer load, but simplest recovery chain.
Incremental
Best for: daily windows. Moves changed data only, but verification and catalog work still matter.
Differential
Best for: midweek restores. Grows until the next full, so the window can creep upward.
Synthetic Full
Best for: low source impact. Reads less from production, but storage-side merge speed can bottleneck.
| Scenario | Data | Typical Streams | Window Risk |
|---|---|---|---|
| Home NAS full | 4 to 12 TB | 2 to 6 | Network or disk read |
| VM incremental | 250 GB to 2 TB | 2 to 8 | Changed block scan |
| Database full | 1 to 8 TB | 4 to 12 | Compression CPU |
| Media archive seed | 10 to 40 TB | 4 to 16 | Offsite uplink |
| Laptop fleet | 100 GB to 1 TB | 1 to 4 | Client Wi-Fi |
| Link or Device | Nominal | Usable MB/s | Notes |
|---|---|---|---|
| 1 GbE | 125 MB/s | 90 to 115 | Common NAS cap |
| 2.5 GbE | 312 MB/s | 220 to 285 | Good home lab upgrade |
| 10 GbE | 1250 MB/s | 700 to 1100 | Disk or CPU may limit |
| USB HDD | Variable | 80 to 180 | Sequential reads vary |
| SATA SSD | 550 MB/s | 350 to 520 | Compression often next |
A backup job that’s taking too long causes dread. You sit there watching a slow-moving progress bar and know it will be a long night. What’s going on here? It’s a disconnect between what you expect and what you’re experiencing. When you see “gigabit Ethernet,” you expect one gigabyte per second, except then you remember about overhead for deduplication. And you forget about how long it takes to verify checksums.
That’s where backup plans goes wrong. And it only helps if you feed it realistic numbers. For example, it factors in the size of your source data. How much gets compressed and deduplicated before leaving the drive? Why does this matter? Usually the limiting factor isn’t disk speed but rather network bandwidth. If most of your data is a bunch of identical blocks (e.g., VM snapshots, log files), you’re sending tiny amounts of actual payload over the wire.
How to Plan Your Backup Time
The tool assumes this data reduction and doesn’t let you over-estimate how long the transfer will take. It takes into account your network limits, your compression capacity, and your read throughput. It then calculates which one are actually the bottleneck. Network speed is something everyone tends to worry about. This is one of those things that’s actualy visible to users: You see the number in your router settings.
Disk read speed, however, frequently lags behind. Even if you have a single physical drive, adding too many streams pulling from it can reduce its speed. The calculator allows you to select parallel streams and model how they would performs at the same time. Spreading out the workload over several SSD channels or spindles can increase your throughput.
However, more isn’t always better; excessive numbers of stream can lead to head thrashing for mechanical drives and queue depth problems that can stall the entire operation. The tool assists with finding the tipping point between helpful parallelism and harmful parallelism.
The other sneaky cost is verification. Verification (building a catalog and checking the hash) guarantees your backups will be usable. It takes additional time, sometimes minutes or even hours. In reality, if you have big data sets it’s required for your sanity. There’s no getting around it to meet an arbitrary time constraint. To account for it in your planning, I added a verification overhead percentage option to the calculator.
If you find yourself with insufficient time, then consider backing up more frequent using smaller incremental backups. Better to do frequent small things different than scramble for every last ounce of speed against huge full backups. The math completely flips with incremental vs. Full backup strategy. Full = reads all, every time. Simple, slow. Incremental = moves just what’s changed. It shortens the window but increases recovery chain complexity.
The tool lays out various scenarios on a reference table, so you can compare. A full backup on a home NAS is not the same as an incremental database backup. Data structure makes a difference. You know how it works, so you tune your settings instead of guessing around speeds.
Theoretical network interface speeds (such as a gigabit Ethernet connection), are not usually what happens in real life. Packet loss, background traffic and protocol overhead can all reduce what’s actualy happening. The built-in cheat sheet includes useful bandwidth range information for typical configurations. That way you don’t need to use peak specifications; you can plug in something realistic.
Always better than guesstimating based off spec sheets is using previously-measured speeds from other projects. After all, it represents the real world the data will be traveling across. A backup window ultimately is a negotiation with time and physics. There is a finite amount of time, speed, and data.
The calculator doesn’t alter these constraints, but it explains them. It tells you what’s holding things up: is it the CPU compressing, or the network bandwidth, or the disk read? That tells you where to spend on upgrading. Perhaps you could use a better switch. Perhaps you could get faster storage. Or perhaps you simply must realize that certain jobs will require all night and plan accordingly.
That’s really the value: knowing the difference between an accepted limitation and a solvable problem. Letting it turn anxiety into a schedule. And when your backups complete by morning, you can stop staring at the progress bar and actualy go make yourself some coffee.