MySQL and MariaDB replication log planning
Binlog Size Calculator
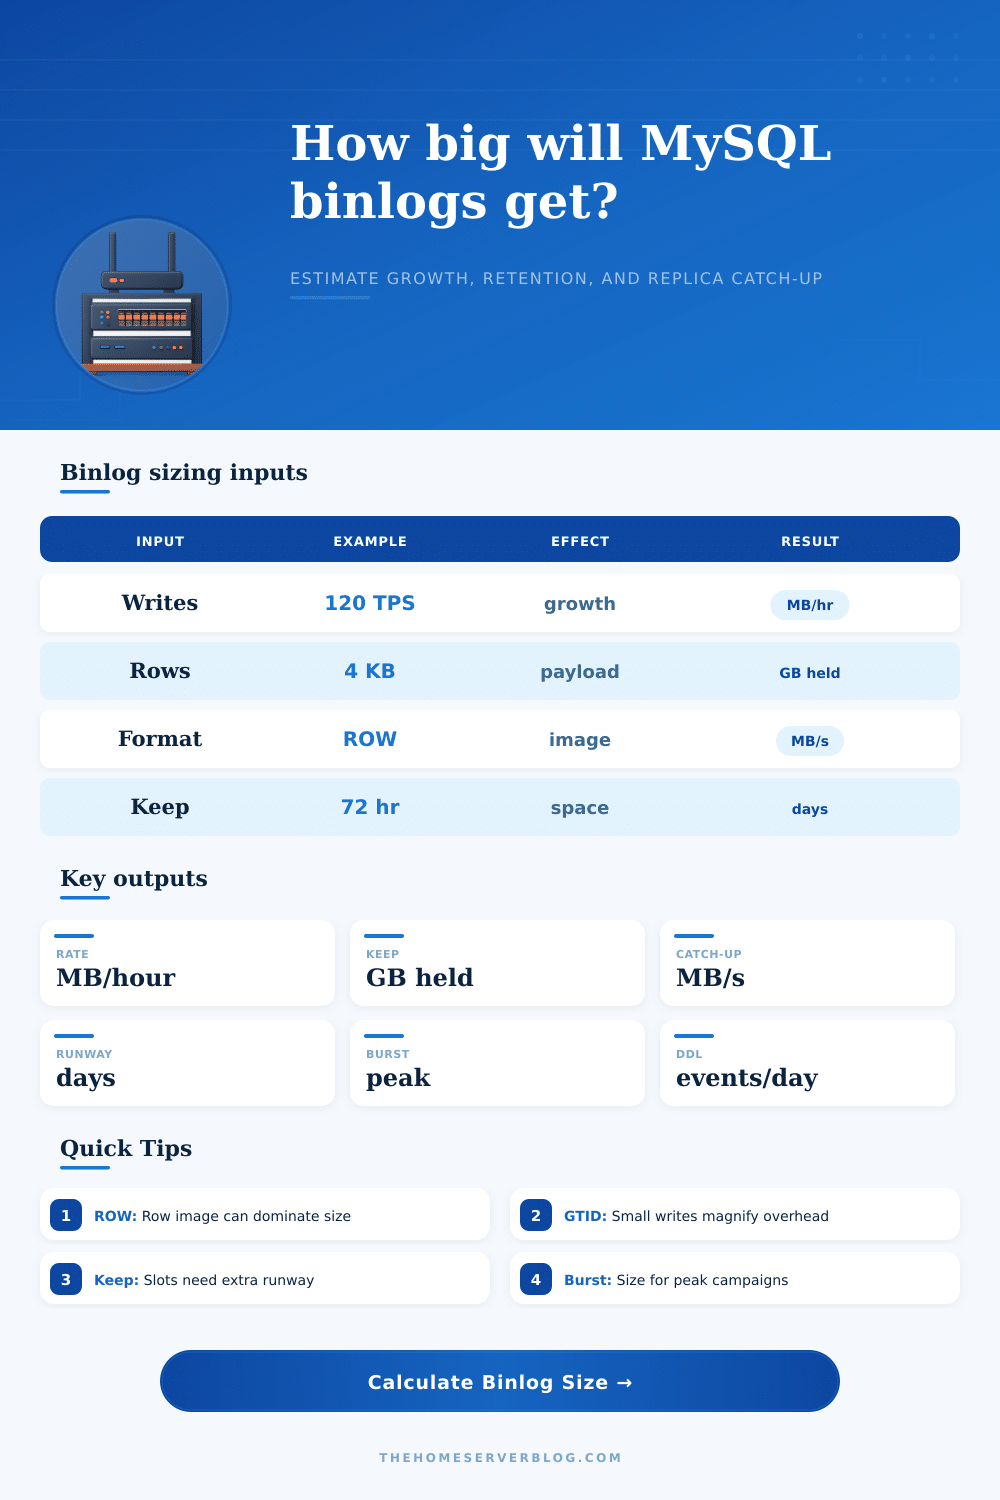
Estimate binary log growth from write transactions, row event size, binlog format, row image mode, changed tables, GTID overhead, DDL churn, compression, burst load, replica retention, catch-up targets, and available binlog volume.
binlog_row_image behavior for row-based logging.
Binlog calculation breakdown
Retention pressure
Strong replication tooling, row metadata options, transaction compression on newer releases, and crash-safe binary log indexes.
Often logs full row images unless changed. Check binlog_row_image, checksums, and expire settings during upgrades.
Uses MariaDB GTID semantics and replication variables; validate format compatibility before cross-family replication.
Good for current deployments, but binlog feature names and defaults can differ from Oracle MySQL documentation.
Retention may be controlled by managed procedures and backup policy. Watch storage autoscaling and replica lag together.
Binary logs are usually for external replicas or CDC. Enabling them can add measurable write and storage pressure.
Common in self-hosted estates with enhanced observability. Confirm compression and backup tooling behavior per version.
Consumers need binlogs retained beyond connector outages. Row image minimal can break some change capture expectations.
| Workload pattern | Typical TPS | Row event KB | Binlog format | Planning note |
|---|---|---|---|---|
| WooCommerce order bursts | 20 to 400 | 3 to 12 KB | ROW or MIXED | Orders touch stock, sessions, metadata, coupons, and email queues, so tables per transaction matter. |
| Home Assistant recorder | 5 to 80 | 1 to 5 KB | ROW | Small frequent sensor writes can make GTID and commit overhead visible compared with payload size. |
| Small SaaS OLTP | 100 to 900 | 2 to 8 KB | ROW | Replica lag often comes from apply throughput, not raw network bandwidth. |
| Bulk import or migration | 1,000+ | 6 to 40 KB | ROW or disabled on staging | Short windows can produce more retained binlog than a full quiet day. |
| Audit or CDC heavy updates | 100 to 1,500 | 8 to 32 KB | ROW FULL | Full row images are useful for consumers but often dominate storage. |
| Logging mode | Size tendency | Replica safety | Best fit | Capacity caution |
|---|---|---|---|---|
| STATEMENT | Small when SQL is compact | Can be unsafe for nondeterministic statements | Legacy simple apps and controlled batches | One query can affect many rows while logging little, so replay behavior must be trusted. |
| ROW with FULL image | Largest for wide rows | Strong deterministic replication | CDC, audits, PITR, mixed app writes | Updates to wide tables or JSON columns can expand binlogs quickly. |
| ROW with MINIMAL image | Often much smaller | Good for normal replicas | High-write OLTP with known consumers | Some CDC tools expect full before/after images or unchanged columns. |
| ROW with NOBLOB | Moderate when BLOBs are stable | Good for BLOB-heavy tables | Media metadata, CMS content, document rows | Changed BLOB or TEXT values still need to be logged. |
| MIXED | Between statement and row | Safer than statement alone | CMS workloads and legacy plugins | Harder to forecast because unsafe statements switch to row logging. |
| Signal | Low pressure | Watch zone | High pressure | What to inspect |
|---|---|---|---|---|
| Retention uses volume | Under 35% | 35% to 70% | Over 70% | binlog_expire_logs_seconds, purge policy, delayed replicas, and backup jobs. |
| Runway until full | Over 7 days | 2 to 7 days | Under 2 days | Free volume, autoscaling, alert thresholds, and emergency purge procedure. |
| Daily binlog growth | Under 50 GB/day | 50 to 500 GB/day | Over 500 GB/day | Large row images, DDL bursts, imports, and transaction compression. |
| Files per hour at 1 GB | Under 2 | 2 to 20 | Over 20 | Filesystem metadata churn, backup copy speed, and archive object count. |
| DDL events per day | Under 20 | 20 to 200 | Over 200 | Online schema changes, partition maintenance, and migration tooling. |
| Consumer type | Uses binlog for | Bandwidth driver | Retention risk | Planning move |
|---|---|---|---|---|
| Async MySQL replica | Read scale and standby recovery | Steady binlog stream plus bursts | Replica falls behind purge point | Keep retention beyond maintenance and network outage windows. |
| Delayed replica | Human-error recovery buffer | Same stream, intentionally delayed apply | Delay consumes retention by design | Add delay time to outage and rebuild runway. |
| Cross-region replica | Disaster recovery | WAN bandwidth and packet loss | Backlog grows during link issues | Size catch-up for burst drain, not only normal traffic. |
| CDC connector | Kafka, search, analytics, cache updates | Row image width and serialization | Connector outage loses source history | Use full images only when downstream systems need them. |
| Backup/PITR archive | Point-in-time recovery | Object copy rate and retention hours | Gap breaks recovery chain | Monitor archive lag and test replay to a timestamp. |
binlog_row_image=MINIMAL can cut row-event volume, but some audit and CDC consumers need unchanged columns or full before/after state.Before you see replication lag, you probably see disk usage alerts. Disk usage alerts aren’t unique in that regard: they happens all the time in database management. Binary logs build up because you think they’re a low-impact log used only for recovery. They accumulate until there is too many of them on drive. Then server can no longer write because it’s out of space. Replication fails. You frantically try to revive your replicas by purging logs.
But all of this panic could of been avoided had you planned ahead by working through the storage math. Once you specify the pattern(s) by which you writes to that storage, the calculator does the math. But what’s important to know is that all of that metadata add up. Most people underestimate just how much metadata are in there. Every single transaction header gets logged. Every single row image get logged. Every single GTID record gets logged.
How to Plan for Disk Space
That’s how we do things with safety nowadays; we’re using ROW-based logging (most stacks). That tradeoff is worth it: we give up some disk space for something that we can determine will be consistent on our replicas every time. Knowing how many bytes this safety cost is key to understanding growth.
First of all, how large is the typical event? It is a few bytes for a basic log entry, which is just an updated value in a single column. It is much bigger when importing data in bulk where each row have many columns like wide JSON. Use this tool to set the average event size per row after compression and other overhead to account for true width of payload.
Secondly, what else gets touched by every transaction? You might be running WordPress/WooCommerce during some flash sale, which means every transaction touches not just stock counts but also email queues and maybe session data too. Every extra table that gets touch scales up the amount of logging. Capture that complexity instead of relying on average of a single query.
But what about the format settings? For example, if you are using CDC tools such as Debezium or Point-in-Time Recovery, then FULL row images gives you the full before-and-after state. That’s great, but it costs a lot in storage space. If your consumer doesn’t need the full picture, you can save a ton on volume size by switching to MINIMAL image mode, which logs just primary keys and changed columns. You’ll have to balance consumer compatibility vs. Storage savings here; the calculator reflects that to help you understand precisely how much tighter row image setting save you in disk space.
There’s also pressure from retention windows. Active replicas is fine with three days’ worth of logs. A crashed CDC connector? A delayed replica? Who knows if that covers them? Purging logs before any of the consumers can get up-to-date means breaking the chain of replication and losing data continuity. To avoid deleting history that some consumer will still need, the tool figures out how much overall retention storage you’ll need for the longest window where that’s possible. Abstract time becomes concrete gigabytes.
Most estimates ignore burst traffic. Yes, steady state looks fine. But databases aren’t flat; they experience spikes from cache rebuilds, report batch jobs, and campaigns. These events can double or triple there usual write throughput. You calculate your disk runway based off steady state, then suddenly a surge hits and your volume gets full sooner than expected. Burst multipliers account for these spikes in order to provide a realistic picture of worst case storage usage. It makes you size your volumes with some breathing room so you avoid those midnight alerts.
Last (but by no means least), you only have so much disk space and only so much patience to manage it as well. By calculating runways and setting good purge policies/alert thresholds, you keep things in check with a healthy system. Is it enough to survive a small outage with no human interaction? Yes. A terabyte of old log files? No. Find balance. Size the volume, plan its growth, and let it breathe. Your binary logs will remain within bounds when next flash sale occurs.