RPO Data Loss Calculator
Estimate how many megabytes and transactions sit inside your recovery point objective when snapshots, replicas, log shipping, and failover detection all have different clocks.
RPO exposure result
Full breakdown
Target consumption
The result uses the shortest viable recovery layer, then compares it with the target RPO.
Typical home server RPO ranges
| Service | Common RPO | Why it matters |
|---|---|---|
| Photo archive | 6 to 24 hours | Batch uploads are painful but usually replayable. |
| Home Assistant | 15 to 60 minutes | Automation history and config changes move quickly. |
| Password vault | 0 to 5 minutes | Recent edits may be hard to reconstruct safely. |
| Family documents | 60 to 360 minutes | Small files, high personal value, easy to snapshot. |
Protection layer meanings
| Layer | Clock to enter | Failure it helps |
|---|---|---|
| Snapshot | Newest restorable snapshot age | Rollback after delete, bad update, or corruption. |
| Replica | Apply lag or synchronous commit mode | Node failure when the replica is healthy. |
| Log shipping | Last safe WAL, binlog, or journal delay | Point-in-time recovery between backups. |
| Failover | Detection and decision time | How long writes keep entering a risky state. |
Lag thresholds to watch
| Metric | Good | Investigate |
|---|---|---|
| PostgreSQL replay lag | Under 30 sec | Above 2 min during normal load |
| MySQL Seconds_Behind_Source | Under 60 sec | Oscillating or unknown |
| Rsync batch age | Under half RPO | Older than the RPO target |
| Backup catalog age | Expected interval | Missed job plus no alert |
Data-loss translation
| Formula | Use | Example |
|---|---|---|
| Minutes at risk x MB/min | Changed data loss | 8 min x 40 MB/min = 320 MB |
| Minutes at risk x tx/min | Transactions at risk | 8 min x 900 = 7200 tx |
| Target - exposure | RPO margin | 15 - 8 = 7 min pass |
| Target - overhead | Snapshot ceiling | 30 - 4 = 26 min |
Backup-only NAS
Simple, cheap, and slow to narrow.
6h-24h RPOSnapshot plus logs
Strong rollback with point-in-time recovery.
5m-60m RPOAsync replica
Fast recovery, but spikes can widen loss.
30s-15m RPOSynchronous pair
Best RPO, higher latency and quorum complexity.
0s-1m RPOTip box: measure the busy hour
Use the write rate from backup windows, camera imports, database vacuum bursts, or media library scans. Average daily writes can understate the true RPO loss.
Tip box: separate rollback from disaster recovery
A local snapshot can beat the RPO during a bad update, while an offsite backup may be the real answer after theft, fire, or storage pool failure.
This calculator is a planning estimate. Validate with restore drills, replica promotion tests, backup catalog checks, and application-level consistency checks before treating an RPO as guaranteed.
Remember that time when you thought everything was fine with your back up…you ran it last night and it worked. Then BOOM! The server crashed and you lost hours of work. You recovered the file system perfectly and have all of your old files back, yet you are missing new ones from the last few hours of work.
RPO is that void. It is not the rate at which it can recover. It is the rate at which it loses data while it waits for recovery. Why? Because while time delays is a factor, data loss is the part that hurts your business or your personal projects in ways time cannot fix, so most people concentrate on how fast they can get it back rather than their RPO. Time delays hurt you, but they don’t impact a business (or your personal projects) like losing data does. Most people concentrate on how fast they can get it back then their RPO.
What is RPO and Why It Matters?
Once you plug in your own set of recovery layers, the calculator above does the math for you, eliminating any guessing about conversions and coefficients. You get forced to recognize that logs, replicas, and snapshots is operating on different schedules. Your last snapshot may be twenty-four hours old, yet your actual safety net (your recent data) is an asynchronous replica with just five minutes of lag. The tool then recognizes what layer represent the most recent viable recovery point, and converts that into both transactions missed and megabytes lost.
That conversion is important: it’s one thing to know you’re looking at a five-minute RPO; it’s something else entirely to know you’re potentially facing four hundred megabytes of possible loss. One is describing time; one is describing volume. Both are important if you want to explain your risk to yourself and your stakeholders.
When people see the different levels of protection, they tend to think that layering them on means you’re just increasing your protection. That’s not how this works; it doesn’t follow the principle of piling on blankets. Your effective exposure is determined by weakest link in your chain. Maybe your database commit works synchronously. But maybe your alert script break so your failover detection has a 30-minute delay. Then you lose a full 30 minutes anyway. That’s what the calculator points out.
It breaks the exposure into the delays for log shipping, replica lag, and snapshot paths. And it points out that your best possible recovery point may actualy be better than expected, as long as your worst case fallback point remain within reasonable limits. Why? Because otherwise you could of end up over-engineering something and under-engineering the rest of it.
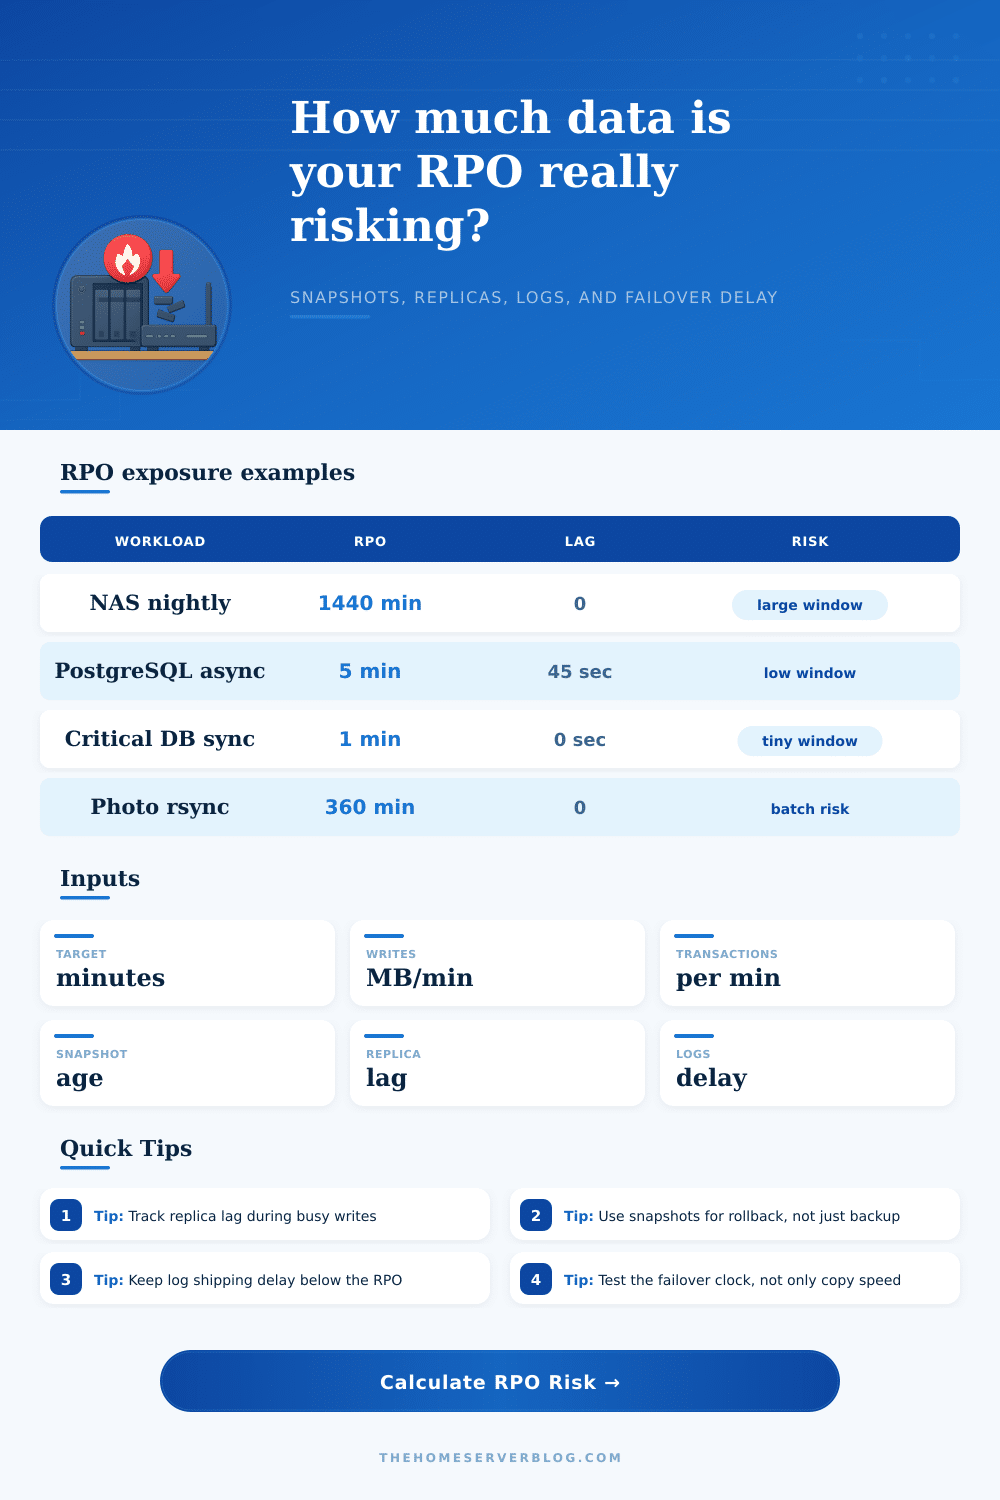
For example, you can compare the requirements of a nightly NAS backup versus a synchronous critical database. The former has a wide window in which data can be lost, great if we’re talking about batched photo archives, not so great if we’re talking about a transactional system where every second matter. The latter requires nearly zero lag. This adds complexity and latency to your architecture, meaning you are trading off performance against resilience.
So how do you know what’s right for you? That’s where the rest of the page comes in: it lays it all out with some reference tables that show typical RPO ranges for various services, helping you set your expectations. For example: maybe you don’t care if your home automation system loses an hour of history… But when your password vault loses recent edits, it creates instant friction! Knowing the context helps you know where you should invest effort.
But here’s the difficult bit: the write rate must be measured during busy times, since the risk is understated by smooth averaging. Your busiest peak will expand the potential for loss even though the average may be low. Database vacuum processes, media library scans, or anything that generates bursts of data can create spikes. Those are what you want to capture. Not the quietest moment.
So enter the sustained changed data rate; what does it do in the busiest hour? That’s how the calculator can tell you how much you’re at risk in megabytes. And it also accounts for the time involved between when it detects something and when someone makes the call to failover. The mechanical delay plus human delay is where most plans come undone.
You have to test your recovery drills. A theoretical RPO doesn’t do you any good if your restore process doesn’t work (or if your replica isn’t in sync with the primary and nobody noticed). While the tool will give you a margin indicator to see if you’re keeping up with your goals, you’ll never know until you actualy attempt restores. Review your backup catalogs on a regular basis. And watch your log shipping delay to make sure it’s below your target limit. Replication lag can spike when you get under heavy load, better to discover those gaps in a controlled environment than in the middle of a crisis.
The bottom line: RPO planning is all about understanding your level of risk and accepting it knowingly, instead of naively assuming it doesn’t exist. There’s no way to avoid the chance of losing data completely, but you can reduce the risk until it is manageable. Measure your exposure (in relevant units) and transform fuzzy fear into measured action.
Don’t strive for perfect. Strive for control. And when the next outage occurs, know precisely what you’ve lost (and why), because that’s better than a shiny dashboard.