Traffic split and failover planner
Weighted Routing Calculator
Model weighted traffic distribution across four backends or regions, then pressure-test the split against per-pool capacity, health, latency penalty, canary cap, error budget, and surge factor.
Live split summary
90/10 Canary routes most traffic to the stable pool while a smaller pool receives guarded production exposure.
Weighted routing breakdown
Capacity pressure
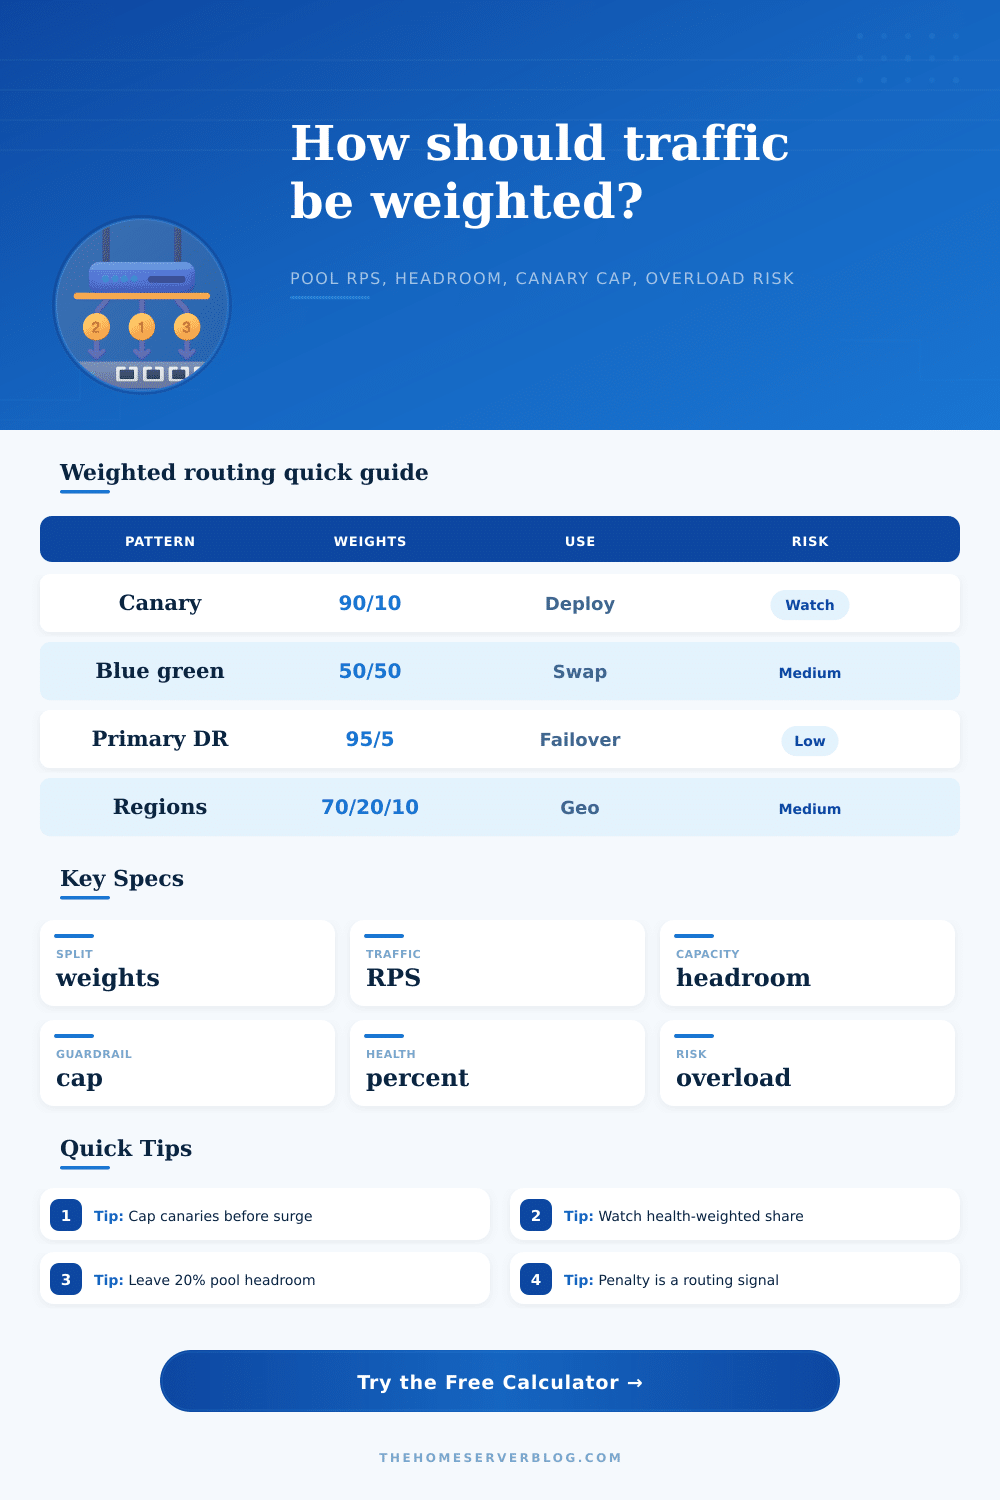
| Pattern | Typical weights | Primary use | Operational watchpoint |
|---|---|---|---|
| 90/10 Canary | 90, 10, 0, 0 | Small production exposure for a new version. | Keep canary error budget and rollback trigger visible. |
| Blue Green 50/50 | 50, 50, 0, 0 | Evenly split traffic while validating the green stack. | Both environments need enough independent capacity. |
| Primary DR 95/5 | 95, 5, 0, 0 | Keep a disaster-recovery path warm and tested. | DR health can look fine while capacity stays too low. |
| Multi-Region 70/20/10 | 70, 20, 10, 0 | Route most users to a preferred region with spillover. | Latency penalty and data locality can dominate user experience. |
| Latency-Biased Routing | 75, 15, 8, 2 | Favor low-latency pools while keeping alternatives active. | Small remote weights still receive full retry bursts. |
| Peak utilization | Status | Meaning | Suggested adjustment |
|---|---|---|---|
| Under 60% | Comfortable | Pool has room for probe lag, retries, and warmup. | Traffic split can usually remain stable. |
| 60% to 80% | Healthy watch | Normal production range for steady traffic. | Watch cache misses and autoscaling reaction time. |
| 80% to 95% | Canary caution | Small changes can push a pool into queuing. | Lower surge, increase capacity, or shift weight away. |
| 95% to 100% | Near limit | Headroom is too thin for retries or partial health loss. | Stop rollout until healthy capacity improves. |
| Over 100% | Overload | At least one pool is routed above safe capacity. | Reduce that pool weight or add capacity before deploy. |
| Guardrail | Calculator input | What it catches | Good starting point |
|---|---|---|---|
| Canary cap | Canary cap percent | New version receives more production traffic than planned. | 5% to 10% for risky code, 25% for mature rollouts. |
| Error budget | Error budget percent | Bad-request share exceeds the reliability allowance. | 1% for many services, lower for user-facing control planes. |
| Health floor | Health percentage | Endpoints are ejected but old weights still imply capacity. | Keep routing conservative below 90% healthy. |
| Latency penalty | Latency penalty ms | Remote pools look acceptable on RPS but harm tail latency. | Investigate once blended penalty is above 20 ms. |
| Surge factor | Surge factor | Retries, deploy warming, cache refill, or failover spikes. | Use 1.2x to 1.5x for normal releases, 2x for failover. |
| Routing style | Best for | Capacity behavior | Failure behavior |
|---|---|---|---|
| DNS weighted records | Regions, origins, simple failover. | RPS may shift slowly because clients and resolvers cache answers. | Health checks need aggressive but safe TTL planning. |
| Load balancer weights | Backends behind one edge or reverse proxy. | Fast changes and clear per-target utilization metrics. | One control plane can change all traffic at once. |
| Service mesh weights | Kubernetes services and versioned rollouts. | Good for canary caps, retries, circuit breakers, and telemetry. | Retry policy can amplify traffic to the weaker pool. |
| CDN origin weighting | Multi-origin cache fill and regional origin fallback. | Miss traffic, not total user traffic, is what stresses origins. | Origin health and cache purge events cause sharp bursts. |
| Application router | Tenant, feature, GPU, and data-aware routing. | Can include capacity and queue depth in the split decision. | Bad routing logic can create hidden hot spots. |
Splitting traffic between several backend pools allow you to serve new code without taking down your site. It’s not magic, it’s about balancing speed with stability through careful use of math. Canary releases send a small slice of users to a new version so that they get the signal without the noise. Blue green deploys flip the switch more aggressively because they assume the new environment are ready. Multi-region routing throws geography into the mix and it balances data locality with latency.
On paper these patterns look similar but in reality they behaves very differently. You press the button and the calculator does the math, and knowing how it did that is every bit as important than the answer.
The Difference Between Capacity and Weight
The biggest error engineers commit is confusing capacity with weight. That’s why they will route ten percent of their traffic to this new pool “just in case” even though the new pool was only provisioned for five percent of overall load. Capacity is physics. Weight is intent.
Surge multipliers accounts for traffic spikes, while health adjustments reduce effective capacity. This thing bridges the two. It makes you think about what you are sending, where you are sending it, and whether those server can really handle it.
The problem with most plans is they fail on surge factors. Sure, a thousand requests per second sounds reasonable at a steady state, but then there’s a cache miss, or a deploy and now there’s a thousand plus some more coming in. That’s when the real world kicks in. Traffic spikes in response to the change. This is reflected in the surge multiplier in the model. Set it to point two and you’re saying that every pool get an extra amount of the load proportional to its weight.
Maybe that little canary pool is only getting a tenth of all the traffic. But as soon as even just a tenth goes beyond what it can handle, errors start spiking. The total volume doesn’t kill the system. What kills the system are the concentrated volume of under-provisioned spots.
The other wrinkle comes from health adjustments. If 20 percent of your main pool fails, their endpoints dissapears from your load balancer, which then directs additional requests to the surviving node. Pressure shifts without changing weights. To model this in the calculator, we adjust effective capacity according to health percentages. This means that you can’t rely on imaginary capacity, there’s none there right now.
You might pass probes and believe your pool is happy, yet send extra traffic there anyway. This is a bad idea when its true throughput has been slowed down by database locks or garbage collection. The numbers reveal these blind spots. Until someone complains about latency, we often forget about latency penalties. Response time goes up as your traffic gets routed to a colder cache or a far away region. That traffic might have sensitive operations too. A minor shift in weights towards a high-latency pool can still worsen everyone’s experience. The tool estimates that mixed penalty and provides some intuition around how bad the split would of been for performance.
It’s a balance between redundancy and speed. Sometimes you want slower response time to get more redundancy, sometimes you just want to keep traffic local and risk higher failure impact. No one-size-fits-all answer here.
These variables are tied together into overload risk scores, which inform you of whether any individual pool will be over capacity. If it’s low, you have headroom. High? Someone’s about to break something. The reference table on the page spells this out clearly: What is your threshold for pausing and what is your threshold for continuing? That lets you know when to tweak things (e.g., add some weight; lower the surge factor; increase capacity). Each change alters the result; it’s a feedback loop that replaces guesswork with visibility.
In the end, weighted routing is a matter of control: “You’re channeling chaos into manageable streams,” and the tools assist in doing that. What are those streams? That’s where the judgment enters. Watch your headroom, and pay attention to the surge. Ten percent doesn’t look like much… Until the servers begin to scream.