HomeServerBlog database recovery planner
Checkpoint Interval Calculator
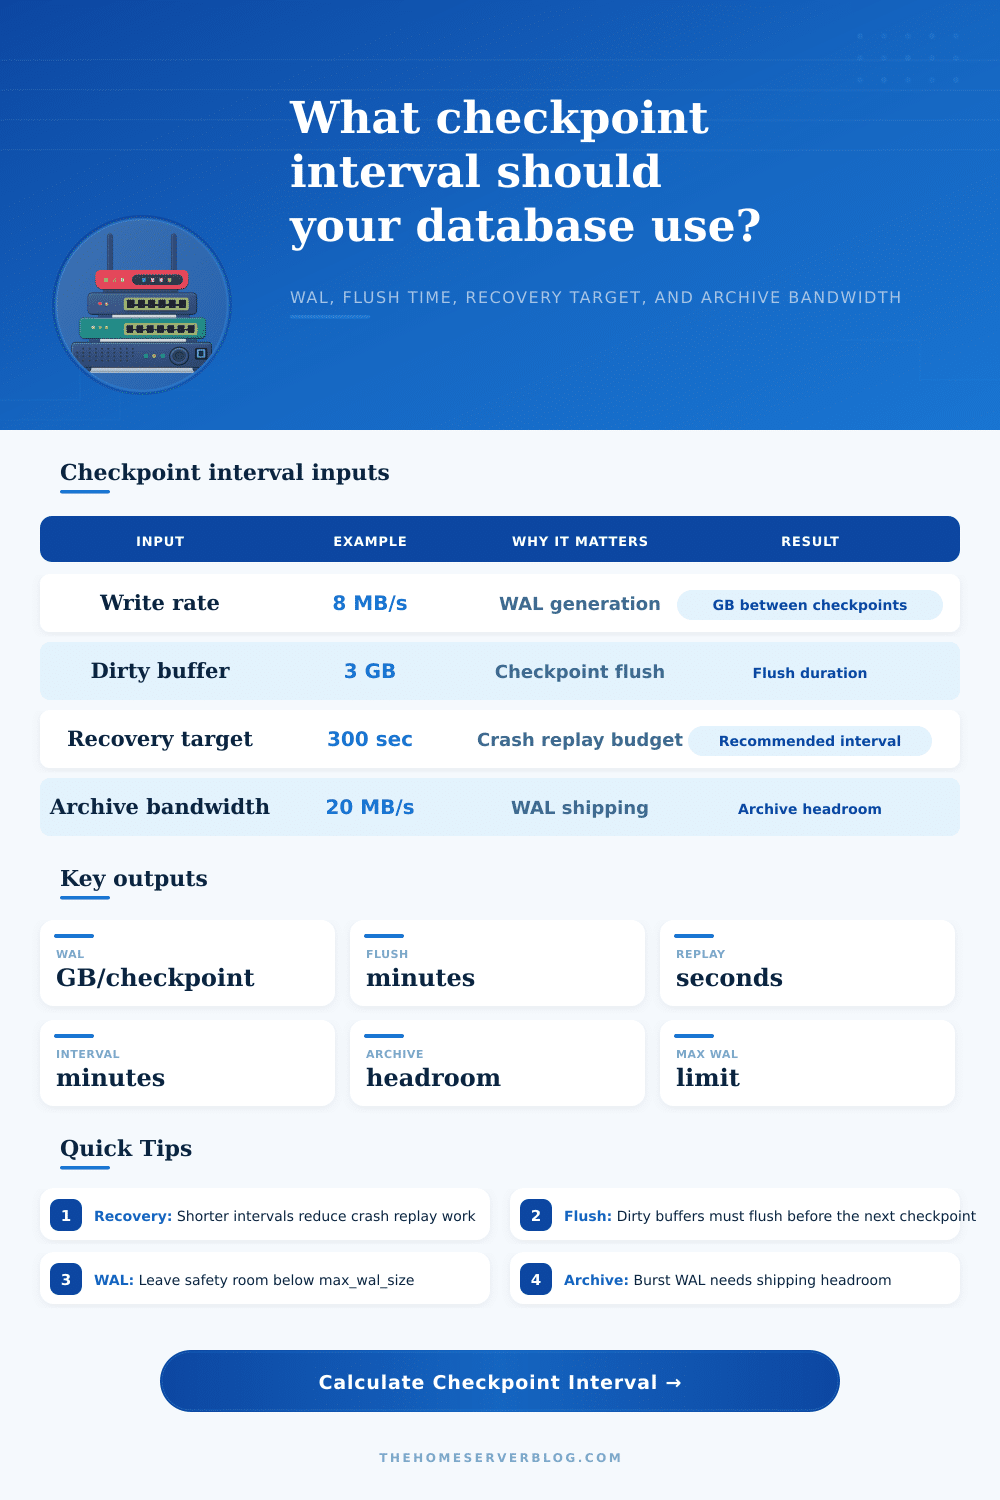
Estimate how much WAL builds up between checkpoints, how long dirty buffers take to flush, how much crash replay time you are accepting, and which checkpoint interval fits your WAL, disk, archive, and recovery limits.
Checkpoint breakdown
Pressure check
Max WAL size after safety buffer. The current interval should stay below this cap during write bursts.
Dirty buffer writeback is modeled against sustained disk flush throughput, not short benchmark peaks.
Archive bandwidth should exceed peak WAL rate enough to absorb jitter and object storage pauses.
Replay is bounded by local I/O and WAL availability, so this calculator uses the slower practical path.
| Preset | Write MB/sec | Interval | Max WAL | Dirty buffer | Best fit |
|---|---|---|---|---|---|
| PostgreSQL OLTP | 8 | 15 min | 8 GB | 3 GB | General application database with steady writes and moderate bursts. |
| Bulk Import Window | 45 | 30 min | 32 GB | 10 GB | Short maintenance period where WAL volume rises sharply. |
| Home Assistant DB | 1.2 | 15 min | 2 GB | 0.8 GB | Small SQLite-to-Postgres or recorder-heavy home server setup. |
| Timescale Metrics | 18 | 10 min | 16 GB | 6 GB | High-ingest hypertables with predictable metric bursts. |
| GitLab Postgres | 10 | 15 min | 12 GB | 4 GB | Git pushes, CI metadata, registry events, and project activity. |
| Low-Write Blog | 0.3 | 30 min | 1 GB | 0.4 GB | WordPress, Ghost, or static-site CMS with light database writes. |
| Write Burst API | 22 | 12 min | 20 GB | 5 GB | Queue-backed service with bursty insert and update waves. |
| Archival Job | 35 | 20 min | 24 GB | 8 GB | Batch ETL or ingest job where archive shipping is the bottleneck. |
| Slow Disk VPS | 3 | 10 min | 3 GB | 2.2 GB | Small VPS or shared storage where flush speed is the main risk. |
| Checkpoint constraint | Calculated limit | Current value | Read |
|---|---|---|---|
| Waiting for calculation | - | - | Use the inputs above to calculate checkpoint pressure. |
| Setting or signal | What it affects | Planning range | Checkpoint note |
|---|---|---|---|
| checkpoint_timeout | Time-based checkpoint cadence | 5 to 30 minutes for many home servers | Longer intervals reduce checkpoint frequency but increase replay work. |
| max_wal_size | WAL cap before size-triggered checkpoint pressure | 2 to 64 GB depending on write volume | Set high enough that normal intervals are not constantly size-triggered. |
| checkpoint_completion_target | How much of the interval can be used for checkpoint writeback | 0.7 to 0.9 | This calculator assumes 0.8 runway for the flush fit check. |
| pg_stat_bgwriter checkpoints_req | Requested checkpoints caused by WAL pressure | Should be low compared with timed checkpoints | Frequent requested checkpoints usually mean max_wal_size is too small. |
| pg_stat_wal wal_bytes | Observed WAL generation | Measure during normal and burst windows | Use the burst multiplier when peak windows matter more than averages. |
| Storage class | Typical sustained flush | Checkpoint behavior | Practical action |
|---|---|---|---|
| NVMe SSD | 500 to 2500 MB/s | Usually WAL cap or recovery target limits interval first. | Use measured writeback, then size max_wal_size for bursts. |
| SATA SSD | 180 to 500 MB/s | Good for OLTP, but large dirty buffers can still create writeback spikes. | Keep dirty data and checkpoint target aligned with real flush speed. |
| HDD mirror | 60 to 180 MB/s | Long checkpoints can collide with foreground writes. | Prefer smaller dirty buffers and a moderate interval. |
| Shared VPS block storage | 20 to 160 MB/s | Noisy-neighbor latency can stretch checkpoint writes. | Add safety buffer and monitor requested checkpoints after bursts. |
| Network archive target | 5 to 200 MB/s | Does not flush dirty buffers, but can delay WAL availability. | Make archive bandwidth higher than peak WAL rate, not just daily average. |
This planner estimates checkpoint sizing from steady write rate, burst rate, dirty data, disk flush speed, archive bandwidth, and recovery target. Always validate with PostgreSQL metrics and real storage behavior before changing production settings.
Your PostgreSQL server has been tuned to within an inch of its life: connection limits tweaked; memory buffers tuned; everything just right. Finally you get to the thing called “checkpoint interval,” which most people leave at default value because messing with it sounds like a bad idea. Sound familiar? Perhaps you’ve seen this in action before. Your database hums along happily for hours, and suddenly everyone’s stuck waiting on a loading screen as the database try to perform a normal background sync. Or maybe more often, your disk get filled up with so many WAL files that they’re never getting archived by the backup jobs.
In those cases, it isn’t usually a misconfiguration. Instead, it’s a mismatch between how fast your writes occurs compared to how quickly your disk cleans them up.
How to Find the Best Checkpoint Interval for Your Database
So what’s a checkpoint? Most folks believe they’re simply for saving your work. Nope. A checkpoint manage modified pages (pages in memory that need to get written to the physical disk). That way when the power goes out, all those pages will be on disk so your system can recover from them. You don’t want your recovery window to be too large after a crash. If you go too far the other way, the disks writes constantly. This causes write amplification (slows everything else down) and reduces disk I/O. So it’s really about finding that sweet spot of tight recovery window with low disk I/O. By knowing your real-world disk speed and write rate, this takes away any guessing about safe margins.
But it doesn’t just spit out a time number. It finds the pressure points most people overlook. For instance, it computes how many WAL files has been generated since your last sync and then checks if you’ve hit your max_wal_size limit. If so, it will cause unexpected performance spikes as the database takes special checkpoints in response. The system is doing its best to dump data to disk ASAP, even though it’s not always the most efficient way, but it’s safest.
The other key number is flush time. How much time do you believe it will take to flush all those dirty buffers into storage? If you’re writing three gigabytes of dirty buffers from memory and your disk can handle only 100 megabytes per second, then you’ve got yourself some serious I/O contention going on here. That’s modeled by the tool, taking into account what hardware you’re running (fast NVMe drives vs. Shared virtual block storage). It looks at archive bandwidth as well.
Backup admins tend to overlook that WAL shipping to the backups is part of recovery chain. While it won’t make it crash right now if the archive pipe is clogged, it will add stress when you’re under a heavy write burst and limit how far back you can safely restore too.
There’s also some good context around typical scenarios baked into the tool’s presets. An ongoing OLTP workload is not the same as a bulk import window. During an import, you’ll see dramatic spikes in writes. This means that you want to have more space in the max_wal_size buffer to soak up the shock rather then trigger a premature checkpoint. By comparison, a home automation database or a low-write blog will produce just a trickle of WAL, so it’s very safe (and efficient) to go for long periods between checks. It all makes sense, and lets you know if you should set things permanently or adjust them as your load changes.
Technical recovery targets depend on how much risk you are willing to take. Want your business to only go down for 10 minutes at a time? That gives you some breathing room to let your logs be played back from disk. In that case, you may extend the checkpoint interval, saving substantial I/O overhead. But do you want to be nearly instantly available? Shorten the intervals, just make sure your disk subsystem can handles the flushing rate without bottlenecking up. No one-size-fits-all here; it’s all about your particular set of operating limits and storage characteristics.
First, measure your true WAL generation on peak hours (not averages). Next, test against your existing settings with real numbers. Finally, tweak just one variable at a time: either change the WAL size cap or adjust the interval duration. Observe what happens. The goal is a system that automatically syncs data in the background while not hindering your operations. The work gets spread out evenly over time. Without this balance, it would of been as if the work is being “dumped” all at once. That balance ensures your database remains reliable when it matters most.