PostgreSQL vacuum and bloat planning
Vacuum Frequency Calculator
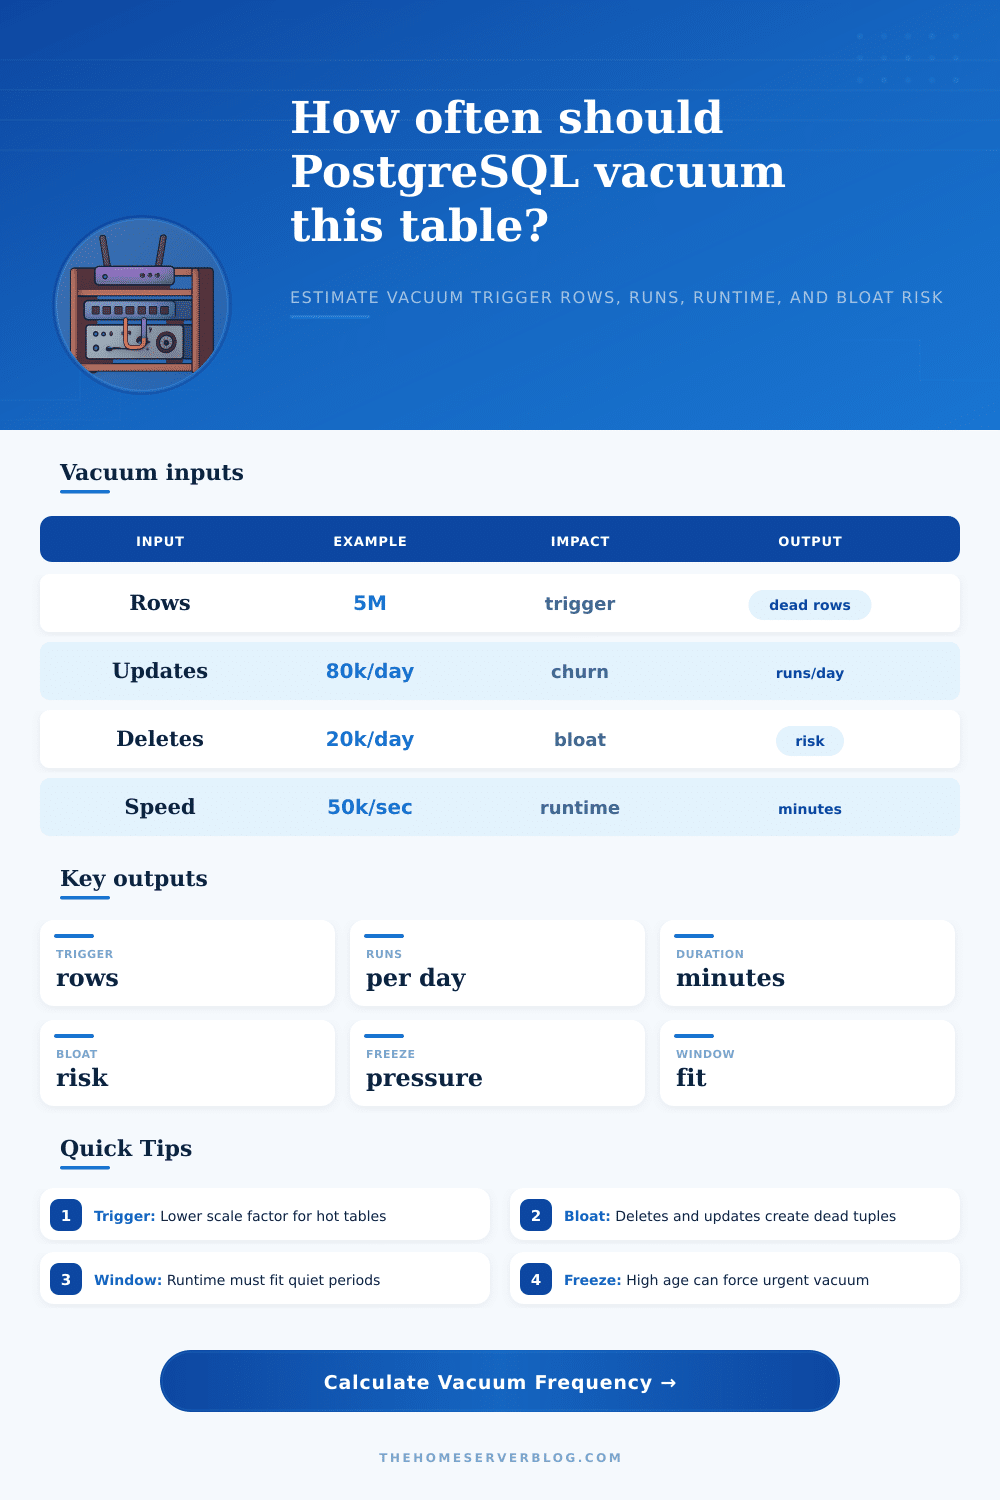
Estimate when PostgreSQL autovacuum triggers from table rows, update and delete churn, scale factor, threshold rows, vacuum scan speed, bloat tolerance, freeze age pressure, and available quiet-window time.
Vacuum breakdown
Risk gauges
Trigger formula
Autovacuum normally starts when dead tuples exceed threshold plus scale factor times estimated table rows.
Dead tuple source
Updates create old row versions and deletes create removable tuples, both counted by vacuum statistics.
Large-table tuning
A low scale factor with a modest threshold keeps huge relations from waiting for millions of dead rows.
Freeze pressure
High transaction age can force anti-wraparound vacuum even when normal bloat settings look acceptable.
| Setting | Typical default | What it controls | Practical tuning note |
|---|---|---|---|
| autovacuum_vacuum_threshold | 50 rows | Fixed dead-tuple floor before vacuum can trigger. | Raise for tiny noisy tables only when churn is harmless. |
| autovacuum_vacuum_scale_factor | 0.2 | Dead tuples allowed as a share of estimated table rows. | Lower to 0.01 to 0.05 on large or high-churn tables. |
| autovacuum_vacuum_cost_limit | cluster dependent | How much cleanup work a worker can do before sleeping. | Increase with care when vacuums fall behind IO capacity. |
| autovacuum_vacuum_cost_delay | cluster dependent | Sleep time inserted after cost limit is reached. | Reducing delay shortens runtime but can add IO pressure. |
| Preset | Rows | Daily churn | Autovacuum strategy |
|---|---|---|---|
| Small App Table | 250,000 | 8,000 changes | Default-like threshold with moderate scale factor is usually fine. |
| High-Churn Queue | 1,200,000 | 1,500,000 changes | Use a very low scale factor so dead rows do not dominate the queue. |
| Append Mostly Events | 25,000,000 | 60,000 changes | Vacuum frequency is low unless retention deletes run in batches. |
| Session Table | 3,000,000 | 850,000 changes | Short intervals help reuse space and preserve index locality. |
| Audit Log Table | 80,000,000 | 350,000 changes | Partitioning often matters more than aggressive vacuum on old partitions. |
| Woo Orders Table | 900,000 | 55,000 changes | Lower scale factor helps stores with frequent status updates. |
| Metrics Rollup | 12,000,000 | 1,300,000 changes | Keep runtime inside quiet windows or split by partition. |
| Multi-Tenant Records | 18,000,000 | 420,000 changes | Watch tenant hotspots; global table averages can hide churn. |
| Huge Fact Table | 450,000,000 | 2,200,000 changes | Per-table reloptions and partition vacuum are usually required. |
| Window usage | Meaning | Likely symptom | Useful response |
|---|---|---|---|
| Under 50% | Vacuum fits comfortably. | Low interference with normal traffic. | Keep settings and monitor n_dead_tup trends. |
| 50% to 90% | Vacuum fits but has little slack. | Occasional overlap with peak application load. | Improve IO, reduce cost delay, or schedule lower traffic windows. |
| 90% to 125% | Runtime is near the quiet-window limit. | Workers can still be active when traffic returns. | Lower trigger size, split partitions, or tune worker cost limits. |
| Over 125% | Vacuum does not fit the window. | Bloat can accumulate between long scans. | Partition, add capacity, or use table-specific autovacuum reloptions. |
| Bloat signal | Calculator cue | PostgreSQL check | Tuning direction |
|---|---|---|---|
| Trigger exceeds tolerance | Bloat risk becomes high. | Compare n_dead_tup with reltuples and table size. | Lower scale factor or threshold for this relation. |
| Runs are too frequent | Many cycles per day with short intervals. | Check autovacuum logs for repeated small vacuums. | Raise threshold slightly or reduce update churn. |
| Runtime is too long | Quiet-window usage exceeds 100%. | Review cost delay, IO wait, and buffer hit behavior. | Increase effective speed or partition the table. |
| Freeze age is high | Freeze pressure warning appears. | Inspect age(relfrozenxid) against freeze max age. | Run manual VACUUM FREEZE planning before emergency pressure. |
This is PostgreSQL vacuuming. How it works: You deploy the database. Maybe configure a couple settings initially. After that, you don’t really need to think much about dead tuples. They just eat away at your storage space so let autovacuum take care of it for you as you work on developing features. Everything runs great. Queries perform exactly as expected. Tables is clean. Indexes stays in shape.
And then there’s Tuesday morning. Your slow query log goes haywire, and you realize that background maintenance never kept pace with your app changes. However, if we want to understand how and when this might break down, we need to look beyond the config files; autovacuum isn’t magic. It’s a scheduler balancing two conflicting needs: to clean up dead row versions quickly enough to avoid bloating tables, while keeping its nose out of the way off user traffic (so your website doesn’t stutter). Most people simply vacuum and move on (set-and-forget), which works well enough for small dbs but is risky for anything with some real scale.
How PostgreSQL Vacuuming Works
Understanding what’s really being measured in these stats are the key. PostgreSQL handles updates by marking row’s original copy as dead, then writing its replacement to some new place. Why? It enables multi-version concurrency control, so no reader ever needs to block any writer. That’s a brilliant architectural decision with one flaw. All those dead tuples just sit there accumulating until vacuum reclaims their space. Your app updated 10k rows this hour? You’re creating garbage at an industrial scale.
The autovacuum daemon monitors this churn. It uses a formula weighted by configuration, table size, and update rate to decide when to start a cleanup. That’s why the inputs to the tool reflect actual pressure put on them by reality. First you’ve got your base number of live rows. That’s the set-up.
Next you’ve got your daily update/delete churn. That’s the bit that causes most estimates to fall down, as folks tend to under-estimate just how much data changes. An order in an e-commerce system might only go through a couple of status changes, but an event log or a session table could find every row touched multiple times per day.
Finally there’s the scale factor, which controls how sensitive the trigger is. A high-scale-factor causes PostgreSQL to wait until more dead rows accumulate before it does anything, saving I/O on static tables but increasing the risk of severe bloat on active ones. So what do the numbers tell you? Do they show that you’re running enough cleanup cycles in your maintenance window? Otherwise, at some point you’ll degrade performance.
On page is a reference table that shows what happens with various presets at various load levels. Why should a small config table be tuned differently than a huge fact table? That helps visualize it. Maybe you’ve got low bloat risk and high freeze pressure, then you know you would of better tune for younger transaction IDs instead of reclaiming space. That’s important because regular bloat cleanups performs differently from anti-wraparound vacuums.
There’s no magic number that makes this right; it’s all about making trade-offs. If you lower the scale factor then vacuum happens more frequently. This is good for minimizing bloat, but it is bad to load down your server with lots of background I/O. Raise it and you get the reverse effect. Find the sweet spot where dead tuples are removed frequent enough not to cause performance problems (or fill up your disk) but not so much as to hog resources from other parts of your server.
It’ll manifest itself in some way if you monitor your systems, monitoring tools will tell you what signs are. Predictive modeling can prevent those issues from happening in the first place. Set the settings conservatively then change them according to what actualy happens in practice, not in theory. Monitor the database logs to ensure vacuum times are right… Not too small (wasting time) or too large (getting bloated).
Keep incrementally tweaking the scale factor and threshold rows until the database does its own housekeeping efficiently but without calling much attention to itself. Each table can have different settings, letting some tables clean themselves up aggressively while others just sit as old, cold archive data.
It’s a self-cleaning database: when done right, vacuuming dissapears from view again. Queries remain snappy, diskspace remains under control, and we all go back to feature building instead of battling storage bloat. The effort to tune the frequency just right is worth this quiet and reliabel way it works.