Control Plane Sizing Calculator
Estimate Kubernetes control-plane vCPU, RAM, etcd storage, and API headroom from worker nodes, pods, API requests per second, etcd database size, controller count, CRDs, audit log weight, HA replicas, and safety buffer.
1 Choose a Kubernetes Preset
2 Enter Control-Plane Inputs
Control-Plane Sizing Breakdown
API Pressure Meter
API utilization is calculated after audit, CRD, controller, and node-watch adjustments.
3 Control-Plane Spec Grid
Single Node Lab
1 replica, compact resources, simple backups, no control-plane failover.
Small HA
3 replicas, odd etcd quorum, enough CPU for upgrades and one-node maintenance.
CRD Heavy
More RAM per replica for watch cache, discovery, operators, and custom objects.
API Busy
More API server CPU and audit-aware storage for GitOps, CI, and monitoring bursts.
4 Reference Tables
| Input driver | Why it matters | Primary pressure | Sizing response |
|---|---|---|---|
| Worker nodes | Kubelet heartbeats, node leases, endpoint updates, and watch fan-out grow with node count. | API server CPU and scheduler memory | Add API CPU and leave upgrade headroom. |
| Pods | Pods create status churn, endpoint churn, scheduler objects, events, and watch cache entries. | RAM and scheduler/controller CPU | Raise RAM before the cache starts evicting aggressively. |
| API requests/sec | Automation, kubectl, controllers, CI, GitOps, and monitoring all compete for API budget. | API server CPU and etcd writes | Increase vCPU and HA replicas when sustained utilization exceeds 70%. |
| etcd database GB | Larger state needs more disk, defrag room, snapshots, and compaction margin. | SSD capacity and latency | Use fast local SSD and at least 3x working DB space. |
| CRDs | Each CRD can add discovery data, watches, conversion work, and controller cache memory. | API RAM and discovery latency | Budget extra RAM and CPU for CRD-heavy clusters. |
| Audit KB/request | Large audit events turn API throughput into log write pressure. | Disk write and log retention | Size storage and CPU for JSON serialization and log shipping. |
| Cluster pattern | Typical inputs | Suggested starting point | Watch item |
|---|---|---|---|
| 3-node K3s lab | 3 workers, under 100 pods, light CRDs | 2 vCPU / 4 GB if single control plane | SD card or slow SSD latency |
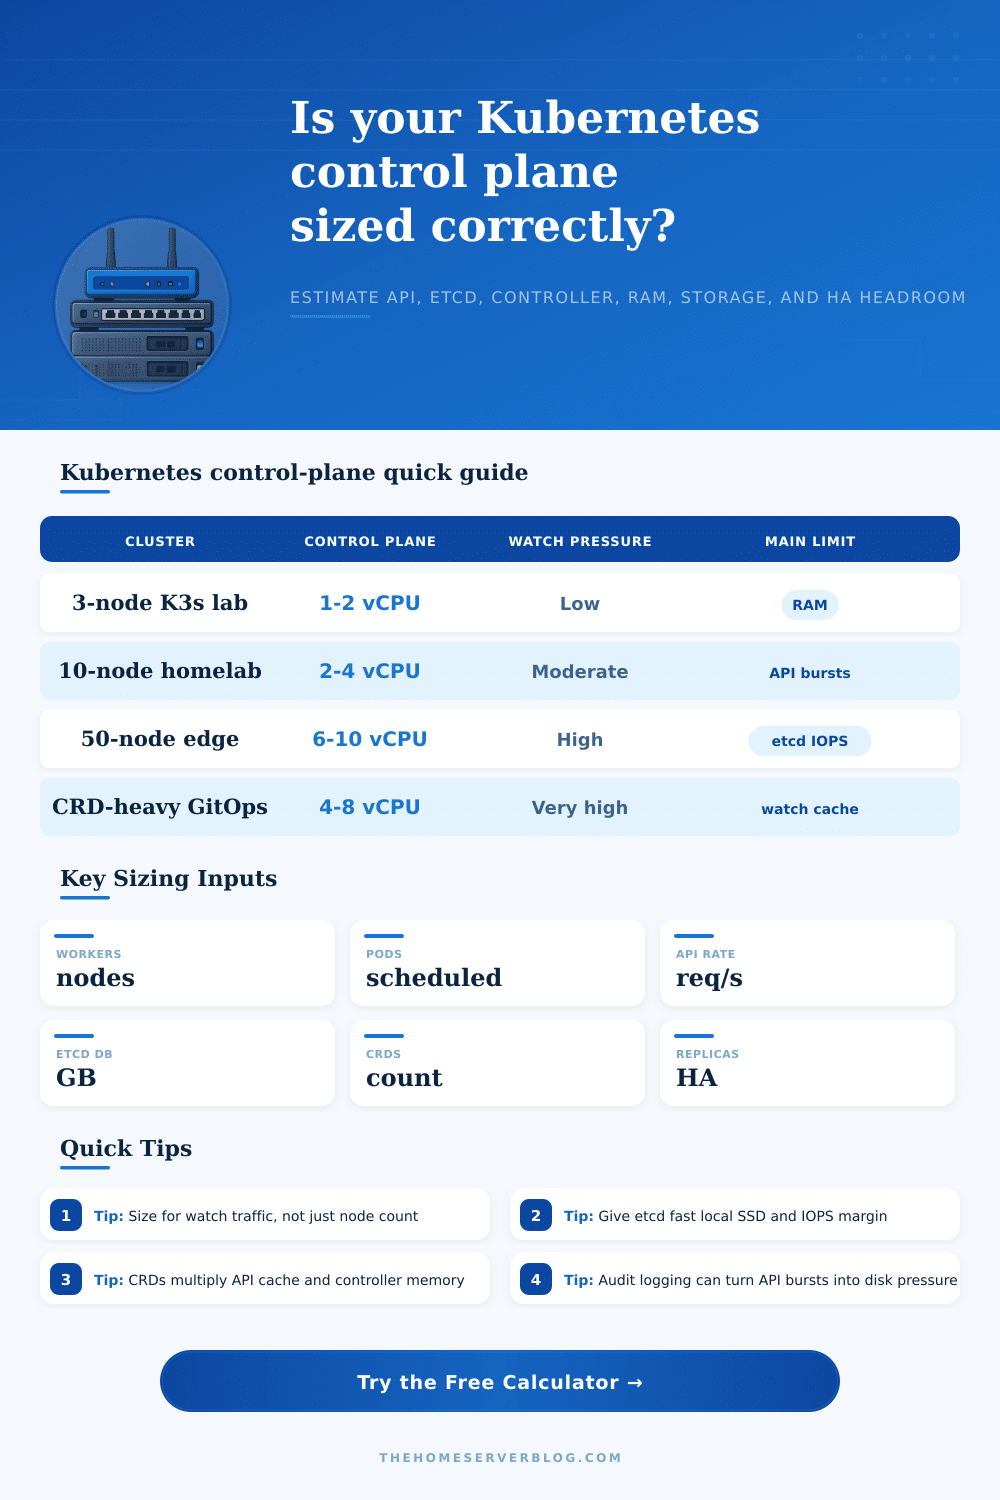
| 10-node homelab | 10 workers, 250-500 pods, GitOps and ingress | 2-4 vCPU / 6-8 GB per replica | API spikes during deploys |
| 50-node edge | Many small nodes, steady heartbeats, modest pods per node | 4-6 vCPU / 8-12 GB per replica | Node lease and watch reconnect storms |
| CRD-heavy platform | 100+ CRDs, many operators, custom resources | 6-8 vCPU / 12-20 GB per replica | Discovery, cache, and controller memory |
| GitOps busy API | High apply rate, CI bots, image automation | More API replicas and audit-aware storage | Request throttling and etcd write latency |
| Component | CPU behavior | Memory behavior | Storage behavior |
|---|---|---|---|
| kube-apiserver | Rises with requests, watches, audit serialization, and CRD discovery. | Watch cache grows with object count and CRD footprint. | Audit logs can dominate local writes if stored on-node. |
| etcd | Rises with writes, compaction, raft replication, and larger databases. | Needs cache for hot keys and stable latency. | Needs fast fsync, snapshot room, WAL room, and defrag slack. |
| kube-controller-manager | Rises with controllers, operators, reconciliation loops, and pod churn. | Informer caches can grow with pods, CRDs, and namespaces. | Indirect pressure through API writes and events. |
| kube-scheduler | Rises with pods, nodes, constraints, and rescheduling bursts. | Stores node, pod, and topology information in memory. | Low direct storage, but high event churn can affect etcd. |
| Measured signal | Healthy target | Tight range | Action |
|---|---|---|---|
| API request utilization | Below 60% | 70-85% | Add CPU, tune clients, or spread traffic across HA replicas. |
| etcd fsync p99 | Below 10 ms | 10-25 ms | Move etcd to faster SSD and reduce noisy neighbors. |
| etcd DB size | Under planned working size | Over 70% of storage plan | Compact, defrag, reduce event retention, or increase disk. |
| API server memory | Under 65% of limit | 75-90% | Increase RAM, reduce unneeded CRDs, or inspect watch cache pressure. |
| Controller queue depth | Brief spikes only | Sustained backlog | Find noisy reconcilers and raise controller-manager resources. |
| Audit log throughput | Predictable and shipped | Bursting above disk budget | Sample rules, rotate faster, or ship off-node. |
5 Sizing Tips
Let’s start at the beginning: One node. That worked. Containers was running; services were deployed. Things seemed great! Now you want to add some more nodes. Someone said audit logging is a good thing, so you flip that switch. Operators is also deployed. Next thing you know, the cluster are slow. API requests are timing out. Deployments hangs forever.
It wasn’t that anything was wrong with your application code… the control plane had choked itself to death. The control plane is most active component in your system and yet most folks treat it as a background process that is static. That said, if you use the calculator above it’ll do the math for you, but let me explain what those numbers mean and how knowing them influences your builds.
How to Build a Good Kubernetes Cluster
Watch pressure matter more than node count. Why? Nodes sends heartbeats to the API server. Pods emit status updates. Controllers watch objects. This isn’t just a request. This is a long-lived connection holding memory inside the API server’s cache. A single dense worker node with heavy workload may create significantly less traffic than half a dozen small edge nodes. To account for this, the tool allow you to decouple pod volume from node count.
This distinction is critical. It prevents you from undersizing for state changes while over-sizing for hardware presence. And then there’s etcd. And here’s where home labs goes wrong. To reduce costs, people run etcd on shared storage or slow disks. Because etcd use fsync operations to ensure consistency, etcd requires super-fast local SSDs with high IOPS. When the disk gets behind, the API server waits. Stall the entire cluster.
The calculator also tell you how much storage you need by factoring in weight of audit logging plus the size of your databases. Audit logging is a silent performance killer. Every request serialized into JSON consume disk space and CPU time. Ignore that input, and you’ll find yourself thinking you’ve got plenty of headroom … until a deployment storm arrives. Then the logs fill the drive and the API server dies from I/O pressure.
Complicating things further are Custom Resource Definitions. For each CRD you’ve added, the API server serve additional discovery data to all clients. Your controllers also get new informer caches. Five CRDs or two hundred CRDs look exactly the same on paper, but inside the cluster you’re running a much more heavy-weight engine. The page’s reference table makes this clear and shows how CRD density move the main bottleneck from CPU to memory. To keep their objects in the watch cache without constant eviction, you’ll need more RAM per replica.
High availability come from combining safety and cost. Replicas aren’t free; they add both capacity and complexity. Deciding what to do require quorum, which means an odd number of etcd members must be available. For instance, etcd needs an odd number of members to make decisions. That’s why we use a safety buffer percentage in our calculator, which adjusts the replica count for quorum dynamics. It’s not only padding, though; it’s insurance against sudden rushes of traffic when watches reconnect following a network blip. A small DNS hiccup without that margin can cause a cascade of reconnections that overwhelms the API server.
There is no one size fits all. You are constantly balancing what you can afford with how complex your software will become. Begin small and expand until you hit pain points that weren’t anticipated. This is normaly. When you are throttled, you’ll want to know what knob to spin. Is it the CPU? Add more cores. Is it memory? Add more RAM. Is it the disk? Upgrade the SSD.
Above all else, make sure etcd stays boring. Do not allow it to fight noisy neighbors for resource control. Resize it after any significant change. How Kubernetes reacts to events and its handling of objects evolve. What worked before wouldn’t of lasted long. Invisible: These are the best clusters. They are the ones who answer requests without complaint and heal from failures without needing to be told. It’s not dumb luck that makes that possible. It takes careful planning to go unnoticed.
The more you know about what’s driving the load, the better you can build something that will support your ambition. Begin small. Measure frequently. Never underestimate how expensive it is to watch everything all the time.