HomeServerBlog SRE reliability tool
Error Budget Calculator
Estimate allowed failures, used budget, remaining SLO headroom, downtime impact, burn-rate warning, alert threshold pressure, and release-risk capacity for APIs, home labs, and production services.
Error Budget Breakdown
Loose internal tools and noncritical dashboards.
Useful for home lab services with manual recovery.
Common API or customer-facing baseline.
Stricter SaaS tier with faster incident response.
Checkout, auth, database reads, and critical paths.
Maximum failures per remaining day before the request budget is exhausted.
Distance between the current burn rate and the configured alert threshold.
Downtime still available in the active measurement window.
Suggested deploy policy from remaining budget, release risk, and burn rate.
| SLO | Error budget | Allowed downtime per 30 days | Allowed failures per 1M requests |
|---|---|---|---|
| 99% | 1% | 432 minutes | 10,000 failures |
| 99.5% | 0.5% | 216 minutes | 5,000 failures |
| 99.9% | 0.1% | 43.2 minutes | 1,000 failures |
| 99.95% | 0.05% | 21.6 minutes | 500 failures |
| 99.99% | 0.01% | 4.32 minutes | 100 failures |
| Burn rate | Meaning | Common use | Suggested response |
|---|---|---|---|
| 1x | Budget burns exactly on pace | Healthy long window | Watch trend only |
| 2x | Budget will run out twice as fast | Ticket alert | Investigate soon |
| 6x | Meaningful service degradation | Fast burn warning | Assign incident owner |
| 14x | High urgency customer impact | Multi-window page | Page and mitigate |
| 36x | Severe rapid budget loss | Critical page | Rollback or shed load |
| Remaining budget | Release risk | Gate | Operational action |
|---|---|---|---|
| More than 50% | Under 15% | Ship normally | Monitor normal canary and dashboards |
| 25% to 50% | Under 10% | Ship carefully | Use smaller batch and tighter rollback |
| 10% to 25% | Under 5% | Guarded release | Require approval and staged rollout |
| Less than 10% | Any meaningful risk | Freeze | Spend time on reliability work |
| Negative budget | Any risk | Stop | Declare breach and restore SLO health |
| Signal | Budget symptom | Likely cause | First SRE move |
|---|---|---|---|
| Failures high, downtime low | Request budget burns first | Partial errors, timeouts, bad dependency | Segment by endpoint and status code |
| Downtime high, failures low | Time budget burns first | Full outage with low traffic | Review availability checks and routing |
| Burn rate above threshold | Future breach likely | Active incident or release regression | Mitigate before root-cause polishing |
| Release risk exceeds reserve | Deploy can consume remaining budget | Large blast radius or weak canary | Reduce rollout size or pause release |
| Projected use over 100% | Window will fail without change | Current burn is unsustainable | Open incident and shift to recovery work |
Services can feel slow without being broken: Error budgets let you handle this class of service.
Every third request time out on the API. Customers start complaining about latency, yet your uptime monitor stay green with no alert fires. Error budgets let you quantify these fuzzy feels of “it’s getting worse” so that you don’t wait until a minor nuisance are a major outage.
What Is an Error Budget?
It’s really simple: Define how reliable your service needs to be, say, 99.9 percent availability for your API. That means there’s a very small slice left over for “oops” moments; about 0.1 percent of your total minutes or requests each month. That is your budget. This is the amount of failure your organization will accept so that you can move fast and innovate. Spend that budget on planned maintenance, latency spikes or even bugs, and you’re spending reliability rather than engineering time.
The calculator above run the math for you… It translates these abstract percentages into real numbers, like X number of allowed failures and Y number of remaining minutes.
The other thing I think most teams miss is requests vs. Uptime: downtime in an empty hour is not the same as high errors during busy hours. Half of your responses is failing? That makes it functionally unavailable (though it is technicaly up). So you want to know about how many request failed *and* how long it was down for, which is what this tool does. You’ll have two views of your health and it will calculate which one is spending your budget faster. You can’t fool yourself with “empty hours” that hide real issues under the radar. That’s the bit where folks misfire. Green lights say they’re safe, but they are using up their request budget even though server stays online.
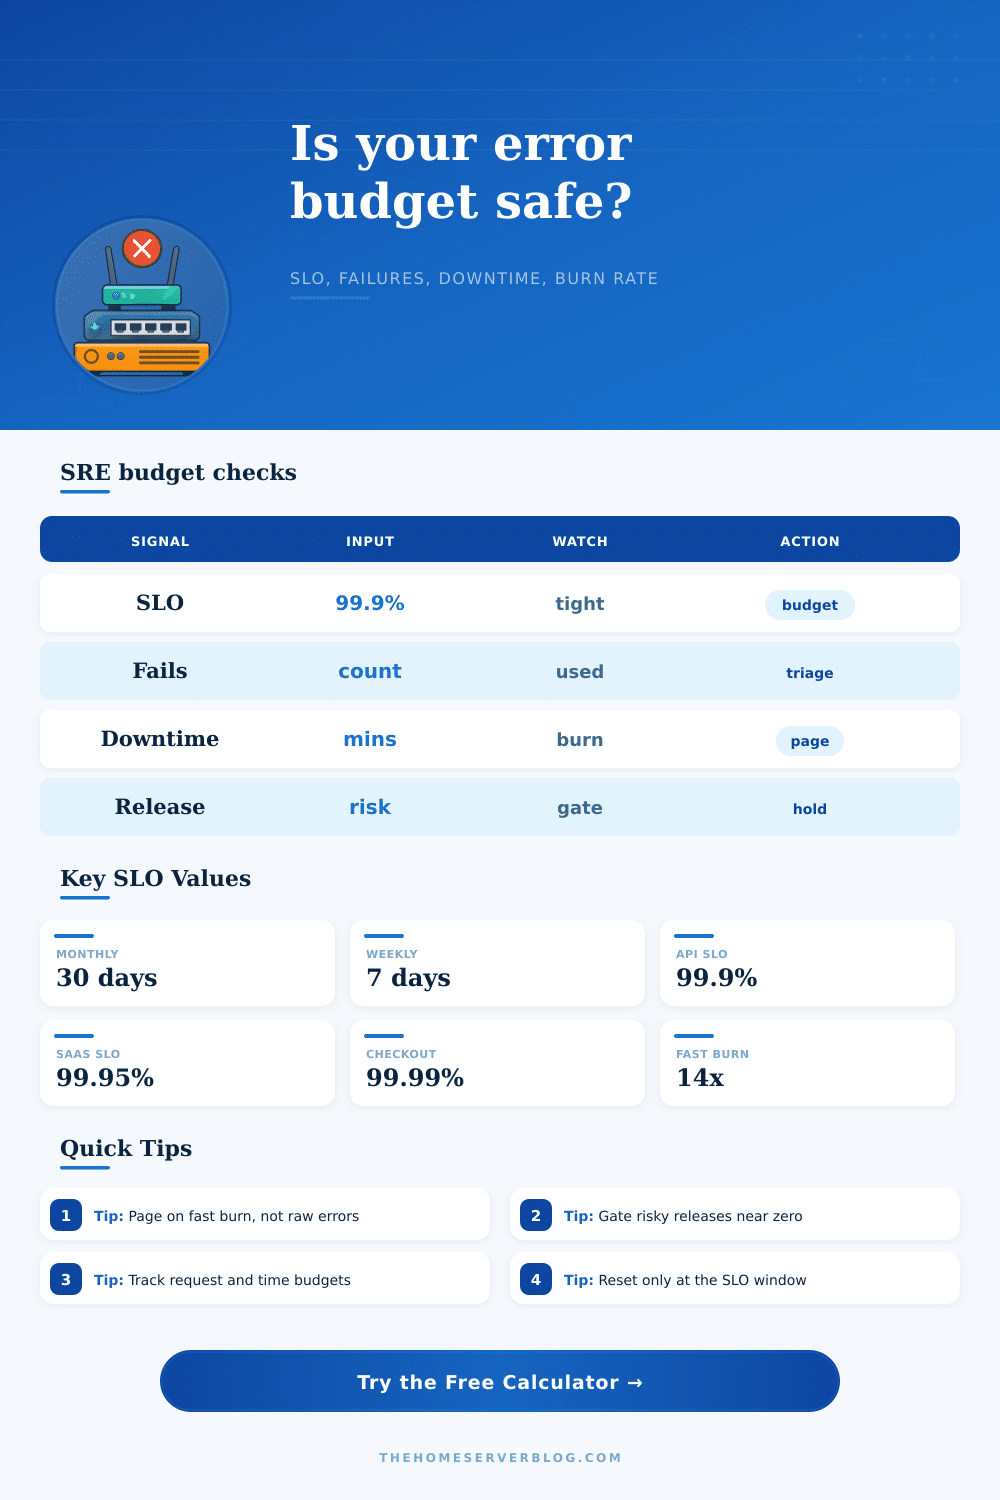
These static values becomes more urgent when coupled with burn rates. For example, if your sustained burn (steady state) allow for X errors per minute and your actual burn is two times X, then you’re burning through your cushion. Typically, once your burn rate reaches 14x, it’s time to go straight to the page. This means you’ve got something realy bad going on which, within hours, might be high enough to break your SLO.
The page itself has a nice little table that explains this. It correlates burn multiples to suggested actions such as rollbacks, tickets, pagers etc. This takes emotions out of it. Burn rate gets to a certain point and you respond based off policy, not fear.
New releases is dangerous, especially if you have a small budget. How close are you to the brink? What’s your headroom for releasing new code? When you have 5 percent of your budget left and the next release has a moderate amount of risk, that puts you in “should we ship?” territory. The tool assesses this by weighing your remaining budget vs. It is the expected impact of this release. It recommends deploying it cautiousy, having someone manually approve it, or freezing deploys altogether and putting your effort into stabilization work. This avoids pitfall of adding more feature work to an already shaky system.
To summarize, an error budget is about making trade-offs between speed and reliability. It makes teams realize that “perfect” doesn’t matter for non-critical parts of their system; most times they don’t need perfect availability because it’s expensive and unnecessary. Quantify your failure to make better tradeoffs. Manage risk instead of chasing perfection. Don’t shoot for zero errors. Instead, invest your allowed errors where they matter. Use up all of them, and it’ll be a red flag to stop adding new features and fix your infrastructure. This brings order to chaotic incident management so it becomes a predictable operational rhythm.