Little Law Calculator for Home Lab Queues
Plan work in process, wait time, runner lanes, and service capacity for backups, CI builds, NAS ingest, media jobs, and internal ticket flow.
Queue Planning Results
| Workflow | Typical Arrival Pattern | Good WIP Limit | Planning Note |
|---|---|---|---|
| Nightly backups | Cron burst after midnight | 2 to 6 active jobs | Limit streams so disk seek and network queues do not stretch the window. |
| Self-hosted CI | Push bursts and scheduled builds | 1 to 3 per runner | Keep runners below saturation so short builds are not trapped behind long jobs. |
| NAS ingest | Camera, scanner, or workstation batches | 2 to 8 batches | Track ingest as jobs, then check the network and parity write limits separately. |
| Media transcode | Large uneven jobs | 1 to 4 per encoder | Measure service time by codec because one 4K job can equal many 1080p jobs. |
| Home IT tickets | Small weekly requests | 5 to 15 open items | Split blocked items from ready work or WIP looks healthier than it is. |
| Queue Type | Service Lane | Useful Throughput Unit | Watch First |
|---|---|---|---|
| Backup jobs | Backup stream or repository task | Jobs per backup window | Repository IOPS, WAN upload, dedupe CPU |
| CI builds | Runner executor | Builds per hour | Cache misses, image pulls, test flakiness |
| NAS ingest | Import worker or copy lane | Batches per hour | Small file overhead, parity writes, SMB locks |
| Media queue | Encoder slot | Titles per day | GPU session limits, storage reads, subtitle passes |
| Ticket flow | Person or focus block | Requests per week | Waiting on parts, approvals, remote access |
| Need | Formula | Home Lab Example | Use When |
|---|---|---|---|
| WIP limit | L = lambda x W | 12 jobs/day x 0.5 day = 6 jobs | You want a cap for open work. |
| Lead time | W = L / lambda | 10 jobs / 20 jobs/day = 0.5 day | You know current WIP and arrival rate. |
| Throughput target | lambda = L / W | 8 jobs / 4 hours = 2 jobs/hour | You need a service rate goal. |
| Utilization | arrival rate / capacity | 1.2 per hour / 2.0 per hour = 60% | You are deciding whether to add runners. |
Batch Queues
Backups, restores, photo import, and NAS ingest usually arrive in bursts. Use a higher variability factor and a hard WIP cap.
Runner Queues
CI and container builds improve when jobs are split by size. Separate long runners from short feedback runners.
Human Queues
Tickets and maintenance tasks need blocked-item tracking. Little Law works best when ready work is counted separately.
Push some code. Nothing happens. The build runner’s sitting there doing nothing. Another job’s blocking it. The thing that you think is broken isn’t broken; it’s actualy just a case of bad queue management. Hardware ain’t infinite; servers are finite lanes. It looks like a failure when in reality it’s just little law.
Little Law lets you look past the guesswork and see the traffic. It is powerful enough to save your weekend sanity. It is also simple enough to scribble down on a napkin. The arrival rate multiplied by the lead time equals work in process. Call them whatever you want: tickets, jobs, backup streams; the math remains unchanged.
Using Little Law to Fix Queues
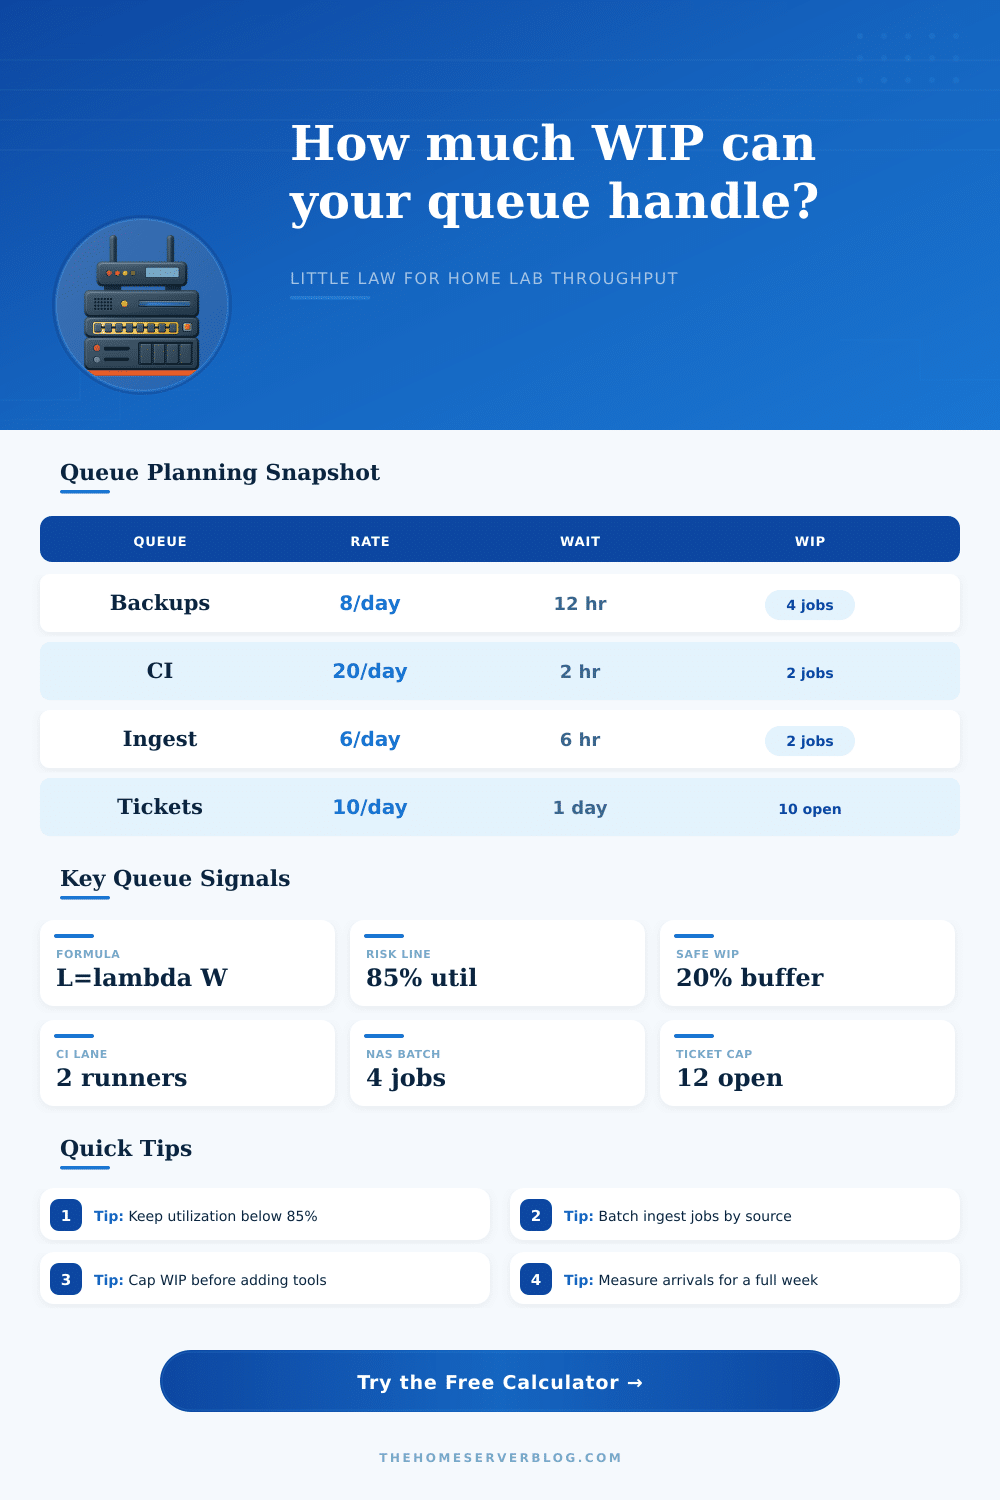
For example, if you’re getting 12 jobs per day and it takes half a day to complete one from start to finish, then you should of had six jobs in the system at any point in time. Put more than six into pipeline, and wait time increases. Plug in your own specific service times and arrival rates into calculator above… It’ll do the math for you (which spares you the headache of having to convert everything yourself). But most people skip this step, trusting their gut instead. Gut feelings lie when queues grows long.
Lead time basically covers any time spent waiting. For instance, a job might be queued up waiting for an available lane. And this waiting happen even when there’s no disk IO: it could be hours in line waiting for a free lane after the job has been accepted. Maybe that backup takes only 45 minutes, but then there was another backup followed by one more, so your lead time is actualy three and a quarter hours. Waiting kills your throughput way faster than sluggish disks can because waiting time is invisible.
If you use average service time as an input to the tool, measure the actual wall clock time from the moment you arrive until you’re done, not just how long it spends actively being processed. That makes a big difference to your WIP cap. That’s where the theory and the messiness of reality collide… Spikes happen, not nice clean hours of arrival. Cron jobs fire near midnight, a team pushes code together, and suddenly everyone arrive all at once. A system running smoothly at average load will buckle at peak loads.
Add some buffer for the spikes! For the bursty arrivals. And yes, you’ll need more headroom if your arrivals are spiky than if they are even. Twenty percent is a safe middle ground. That’s a reasonable sweet spot for most home labs. Run sprints, import batches, then you may want to increase it a bit. It seems wasteful… till the storm comes and you see how it saved the day by having an extra lane.
Don’t let use go above 85% (not a hard number, just a practical one). If you do, the marginal cost of each additional job increases exponentially as the queues become full and wait time doesn’t increase linearly, it spirals. It’s easy to tell yourself “I’ve still got ten percent spare capacity, I’ll add another backup stream.” But you won’t. Once you’re above the threshold, queue dynamics kick in and your response times slows down. Your quick tickets get lost in the shuffle because the person answering them is context switching too much. The page has a reference table laying this out clearly for various types of workflows, showing how small changes ripple throughout the entire system.
Make the math: Set hard WIP limits according to the math and then hold yourself to it. Stopping before you’re done is counterintuitive; there’s always more work to do. But forcing yourself to complete instead of initiate keeps the flow going. If you set hard caps on how many things is in “open” status, those bottlenecks will surface where they’d be hidden under a mountain of busy work.
Maybe you’ll learn that your NAS ingest is slow not because of drive speed, but because the network switch drops packets at peak hours. You need space to see that bottleneck exist. That said, begin with real data… Not guesses at worst-case scenarios, so measure actual arrivals for an entire week. Hypothetical fear loses to real data each and every time. Use what you see, not what you fear, to adjust buffers.
It’s not about maximizing usage; it’s about minimizing friction. When your queues is well-tuned they become invisible. Nothing gets stuck. Backups complete before morning. Builds pass or fail quickly. Tickets resolve instead of aging into stale reminders. You don’t need to buy new gear to feel like you’re back in a fast lab, you need only respect the lanes you have.