Cell Overlap Percentage Calculator
Estimate Wi-Fi, cellular, and AP coverage overlap from radius, spacing, roaming threshold, and channel reuse distance.
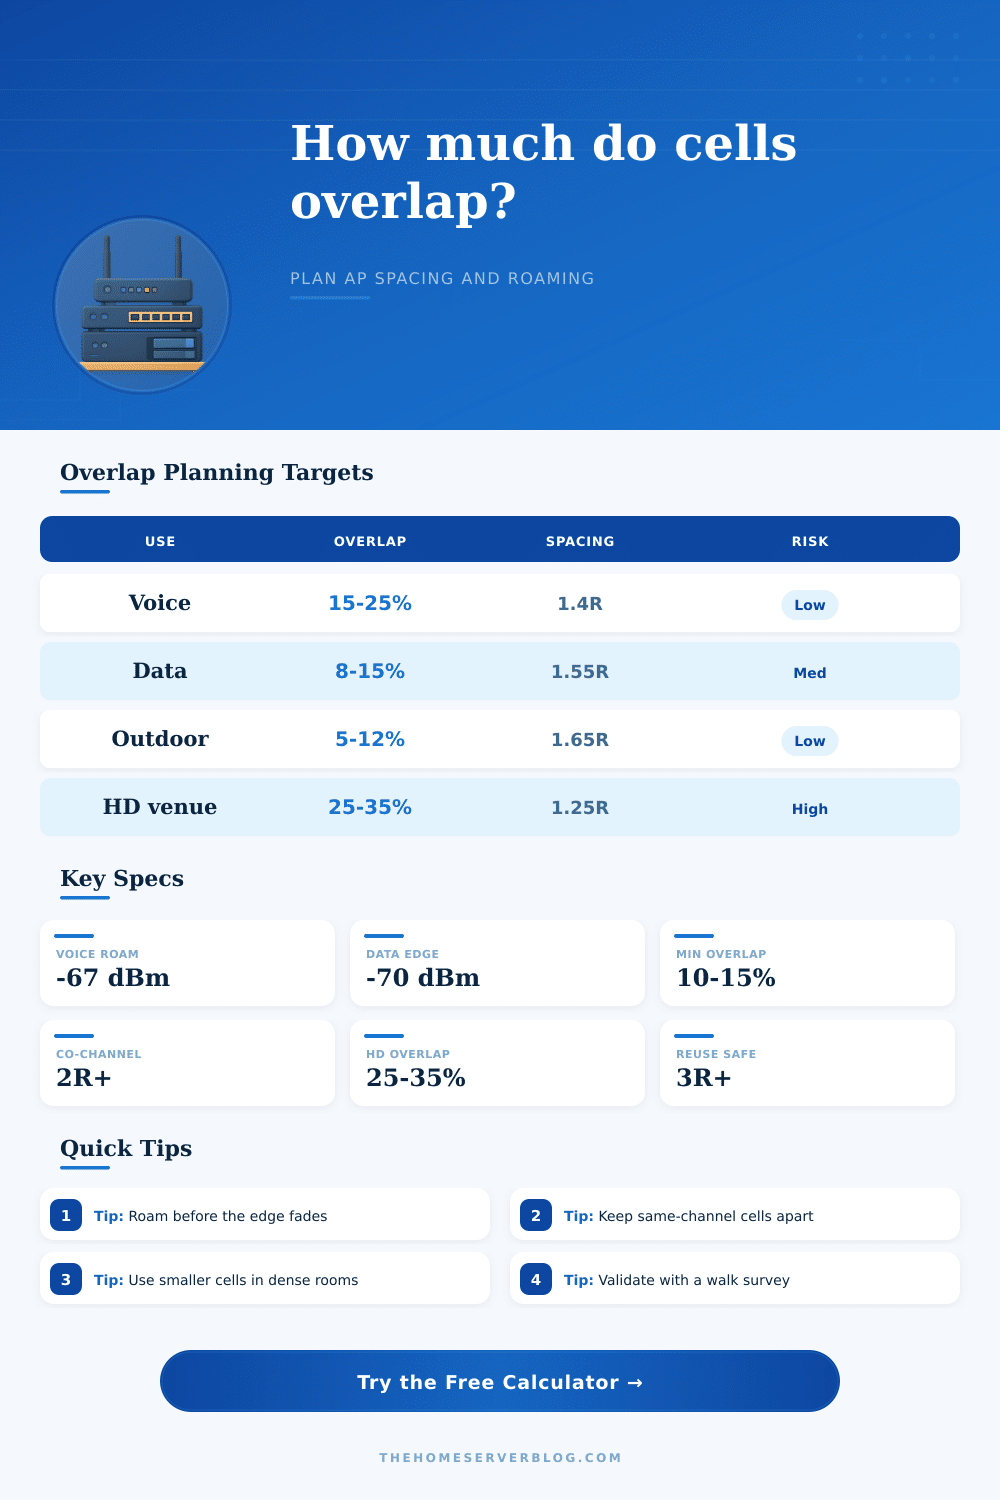
| Coverage use | Overlap target | Spacing guide | Planning note |
|---|---|---|---|
| General data Wi-Fi | 8% to 15% | 1.50R to 1.60R | Good for laptops, tablets, and stationary clients. |
| Voice roaming | 15% to 25% | 1.35R to 1.48R | Keeps calls alive when clients roam before the edge. |
| High-density rooms | 25% to 35% | 1.20R to 1.35R | Use low power and more channels to avoid contention. |
| Outdoor point coverage | 5% to 12% | 1.58R to 1.70R | Works best when clients are not moving quickly. |
| Spacing as diameter | Spacing as radius | Overlap of one cell | Interpretation |
|---|---|---|---|
| 60% | 1.20R | 28.5% | Strong continuity, higher co-channel risk. |
| 70% | 1.40R | 18.8% | Balanced for fast roaming and voice. |
| 80% | 1.60R | 10.4% | Common data network starting point. |
| 90% | 1.80R | 3.7% | Light overlap with possible roam gaps. |
| Band or system | Usable channels | Reuse guard | Practical limit |
|---|---|---|---|
| 2.4 GHz Wi-Fi | 3 non-overlap | 3R or more | Avoid dense same-channel cells. |
| 5 GHz Wi-Fi | 8 to 24 | 2.5R or more | DFS and 80 MHz channels reduce reuse. |
| 6 GHz Wi-Fi | 14 to 59 | 2R or more | Shorter range makes reuse easier indoors. |
| LTE / CBRS small cell | Licensed plan | 3R or more | Neighbor lists and power levels matter. |
| Project size | Typical radius | Typical spacing | Overlap goal |
|---|---|---|---|
| Two-story home | 35 to 50 ft | 50 to 70 ft | 12% to 22% |
| Garage plus house | 55 to 85 ft | 80 to 120 ft | 8% to 18% |
| Office floor | 30 to 45 ft | 42 to 60 ft | 18% to 30% |
| Small warehouse | 75 to 130 ft | 120 to 190 ft | 6% to 16% |
I’m sure you’ve experienced that annoying “dropped call” when you’re in a hallway and walk past the other end. Your phone continues trying to use access point on the other side of the wall rather than connecting to the one around the corner even though it’s showing plenty of signal bars. What gives?
Wireless tech isn’t magic. Generally it boils down to geometry. When designing for coverage, you has to balance distance between cells with how much they overlap. That tradeoff will make your network either feel invisible or frustratingly irritating.
Why Your Phone Drops Calls in Hallways
Once you set the spacing and the radius of the device in question, the calculator above will do the math on the geometry. You put in how far apart centers are from each other and what the effective coverage radius of one device is compared to the other. It gives a percentage showing how much individual coverage areas overlap. That’s your key metric to plan by.
Too little, you have roaming holes where clients drop off, stop moving, and stall out. Too much overlap drowns your radio spectrum with signals competing for bandwidth. This can be more problematic then not having any signal at all.
But the critical thing that almost all planners fail to understand is that you need to design overlap around the roaming threshold, not merely the outer edge of coverage circle. As soon as a client device has access to another networks signal, that does not make it want to start roaming. It waits for its existing signal to degrade to some minimum sensitivity level (typically somewhere around minus sixty-seven decibels for voice traffic) before it even thinks about making the change.
In many cases, it may already be too late by the time it actualy makes the decision to do so: it could of already fallen into a hole. To account for this, the calculator lets you enter both your edge RSSI and your roaming threshold. Then it can displays what the actual overlap looks like when client truly cares whether or not it switches networks. It closes gap between theory and human behavior.
Then there’s the matter of channel reuse. When you’re trying to maximize roaming by packing cells more closely together, you need to consider not only how tightly they’re spaced, but also which channels they use. Co-channel cells will interferes with each other if their signals bleed into one another. There’s a field on the calculator that lets you set same-channel reuse distance, helping you get an idea of whether your spacing ensures co-channel cells remain far enough apart from each other.
With traditional five-gigahertz Wi-Fi, keeping them separated by two and a half times the cell radius or more typicaly helps ensure noise levels don’t get too high. So you’re really asking your channel plan to step up in crowded spaces like venues, where you may be pushing overlaps as high as thirty percent for seamless handoffs.
These calculations are also subject to environmental considerations. For example, a warehouse with metal shelves produce signal blocking that won’t be modeled well by basic circular model. To account for this uncertainty, the tool includes an input for “planning buffer.” Tolerance of plus/minus ten or even fifteen percent will allow for things like furnitures placement, body absorption, and drywall weakening. Better to go slightly overboard than learn too late about dead zones in the conference room.
The ultimate validation comes from walking it. Models are just that, but they don’t account for how walls actualy work. For voice you want more overlap at closer spacing because people move around, if you want no dropped calls then your overlap should be higher. For high density or a data network where you is looking for max throughput/client, you get away with less. Tables on the page gives you some idea what “should” work in the industry versus your target.
So at the end of the day, great wireless design isn’t about achieving absolute signal strength everywhere. It’s about delivering a consistent experience. And that means understanding that for smooth mobile experiences there will be some amount of interference you’re willing to accept. Adjusting your thresholds and your spacing helps you work with the physics of radio waves instead of fighting against them. If you get the math correct up front, then that dropped call shouldnt occur again in the hallway.