HomeServerBlog memory sizing tool
Session Memory Footprint Calculator
Estimate per-session RAM for web apps, dashboards, databases, RDP or VDI desktops, containers, and caches, then size host memory with active concurrency, shared cache behavior, and safety headroom.
Footprint breakdown
Host fit
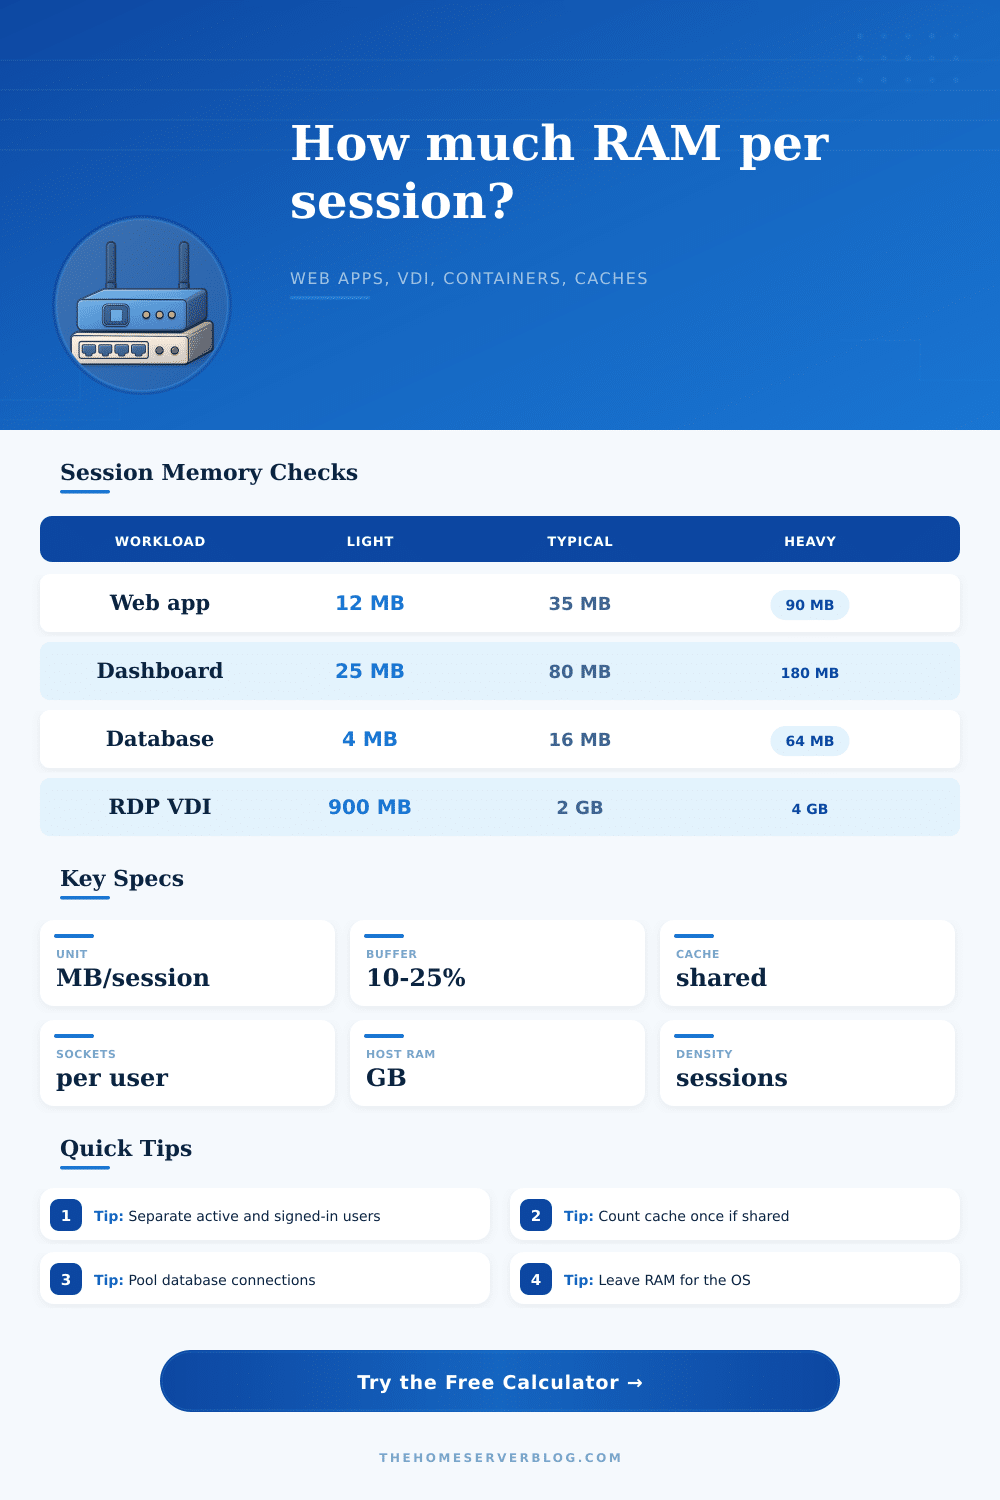
| Workload | Typical MB/session | Shared RAM | Notes |
|---|---|---|---|
| Web app | 15-90 MB | Opcode cache, templates | PHP-FPM and Node apps vary by worker reuse and plugin count. |
| Dashboard | 40-220 MB | Datasource cache | Live charts and websocket queues make active users heavier than idle users. |
| Database | 4-64 MB | Buffer pool | Pooled connections reduce per-user RAM versus one backend process per user. |
| RDP or VDI | 900-4096 MB | Profile cache | Full desktops include shell, apps, graphics buffers, and user processes. |
| Containers | 64-768 MB | Image layers | Per-user containers duplicate runtimes unless memory limits are set. |
| Cache sessions | 1-24 MB | Redis or Memcached | Small session keys are cheap, but serialized profile data can grow fast. |
| Process model | Multiplier | Best fit | Watch point |
|---|---|---|---|
| Pooled workers | 1.00x | Node, Go, Java pools | Long-lived heaps can retain old session data. |
| Threaded service | 1.08x | Java, .NET, Tomcat | Thread stacks and request buffers add up. |
| Forked workers | 1.18x | PHP-FPM, Python WSGI | Copy-on-write savings drop after writes. |
| Per-user container | 1.35x | Sandboxes, IDE labs | Runtime and sidecar duplication is common. |
| Full desktop | 1.55x | RDP, VDI, jump hosts | Apps opened inside the session dominate usage. |
| External cache | 0.82x | Redis session stores | The cache node still needs its own RAM budget. |
| Host RAM | Web sessions | Dashboard sessions | VDI sessions |
|---|---|---|---|
| 16 GB | 80-180 | 25-60 | 3-8 |
| 32 GB | 180-420 | 60-140 | 8-18 |
| 64 GB | 420-900 | 140-300 | 18-36 |
| 128 GB | 900-1800 | 300-650 | 36-75 |
| 256 GB | 1800+ | 650+ | 75-150 |
| Home lab scenario | Sessions | RAM target | Secondary check |
|---|---|---|---|
| Family portal | 25 users | 8-16 GB | Use shared cache and pooled workers. |
| Monitoring wall | 12 displays | 16-32 GB | Limit chart range and refresh cadence. |
| Database-backed app | 100 users | 32-64 GB | Pool connections before adding RAM. |
| Remote lab desktops | 10 users | 32-64 GB | Measure browser and IDE memory separately. |
| Container labs | 20 users | 64 GB+ | Apply cgroup limits to avoid noisy neighbors. |
Your home lab begins with a humble home server, maybe a tiny mini PC or an old laptop. A handful of containers let you run your own cloud and a family portal.
Everything changed one Tuesday night when everyone wanted to watch something on the stream and someone else needed to edit a doc via remote desktop. Suddenly, the disk start thrashing as the system swaps memory into storage, and the interface slows down to a crawl due to lack of physical RAM. That’s the moment, that silent killer of home labs, where ambition overtakes hardware.
How to Plan Memory for Your Home Server
So what’s the issue? It is typicaly not disk speed and not even the processor. It’s the total number of connections to the backend from your open applications, as well as the number of background services and tabs in your browser. Not all sessions are created equally. You have a small token in memory for that simple web request, while an actively polling dashboard with real-time data has a much bigger buffer to manage.
Before this will cause a problem, you can now quantify it using calculator above. The server’s cost-per-session isn’t something most folks audit when estimating their need for servers. They guess at total capacity instead. “I have 16GB of RAM on my desktop computer so I think that will be fine.” That fails instantly when multiple users is sharing that environment.
How do you split idle and active users? A browser window left open all night by an authenticated user takes up very little space. But someone rendering a video feed or making a query against a database does not. This tool helps you adjust that concurrency percentage, which is how many simultaneous sessions you can handle before hitting a bottleneck. This adjustment are often the deciding factor for a smooth experience.
What parts of your stack do multiple users share? Memory isn’t multiplied by number of logged-in users, so things like the database buffer pool or an object cache (Redis) only get counted once. But if you spin up individual containers per user, or give them a full virtual desktop, then memory usage scales linearally. What starts as a reasonable ten simultaneous sessions becomes impossible at fifty. That’s where the multiplier kicks in.
The page includes reference tables that show why remote desktops have different costs different than dashboards and web apps. While a web app may require just thirty megs of RAM per user, a remote desktop could chew up two gigs or more easily. Muddling between these two leads to massive miscalculation of your needs.
People also tend to forget about the operating system. You’ll need to carve out some piece of the pie for your kernel. You also need space for background services, file system caches, and monitoring agents. Don’t cram it full of user sessions; there’s nothing left for the OS to breathe. When there’s a little more than normal traffic and you run out of memory, your OS will start swapping; then everything grinds to a crawl. Better to waste some RAM on an idle server than one that freezes under load. There are fields in the calculator to account for host reserve and base service memory for this very reason.
Your server is your venue for a party. If there’s room to stand and chat, you can pack in more guests then if they all decide to dance simultaneously. The number of dancers currently on the floor is what makes people start dancing. The size of the dance floor (shared cache) doesn’t magically grow to accommodate more guests. Adjusting these values lets you see precisely how many people will fit before the room becomes overcrowded.
For instance, the tool provides a list of presets for typical use cases such as Postgres, Grafana or Nextcloud. Those are just starting points. You want to tweak them based off how you actualy use those services. Do your virtual desktops have people running heavy spreadsheets? Increase the per-session buffer. Are they accessing a web app that’s mostly serving static content? Lower it. The more accurate you can be about what your particular workload does, the better.
To conclude. Planning for memory means no more swap thrash and midnight server restarts. It becomes a predictable model of capacity rather than guesswork. You won’t have to ask why it is slow, but instead will have an exact number of users you know your hardware will reliably handle. When the weekend traffic arrives, a bit of foresight on the front end would of saved a lot of headaches avoided.