VA to Watts Converter
Plan real watt capacity from apparent power for UPS units, PSUs, inverters, PDUs, and home lab load groups.
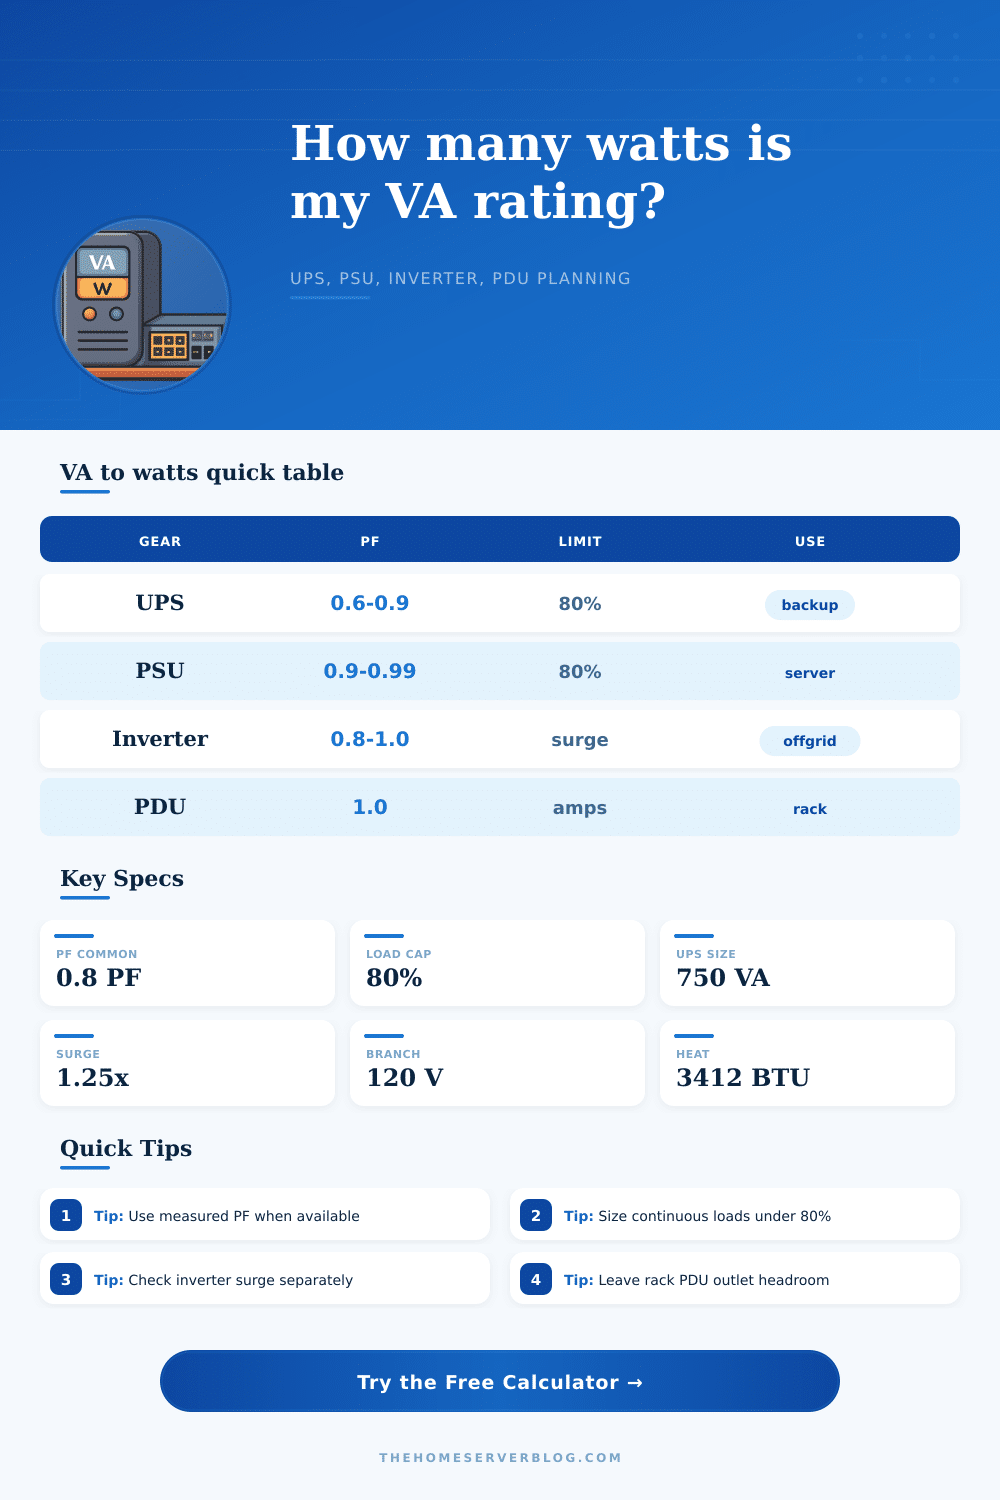
| Equipment | Typical PF | Planning Formula | Home Lab Note |
|---|---|---|---|
| Entry UPS | 0.60 to 0.70 | VA × PF | Check the watt rating, not only VA. |
| Rack UPS | 0.80 to 1.00 | VA × PF × efficiency | Good fit for NAS, switches, and servers. |
| Active-PFC PSU | 0.90 to 0.99 | Watts / efficiency | Best loaded around the efficient operating band. |
| Inverter | 0.80 to 1.00 | Load W / PF | Startup surge rating may be separate. |
| PDU or branch circuit | 1.00 for amp math | Volts × amps | Apply local continuous-load practice. |
| VA Rating | PF 0.60 | PF 0.80 | PF 0.90 |
|---|---|---|---|
| 650 VA | 390 W | 520 W | 585 W |
| 900 VA | 540 W | 720 W | 810 W |
| 1000 VA | 600 W | 800 W | 900 W |
| 1500 VA | 900 W | 1200 W | 1350 W |
| 2200 VA | 1320 W | 1760 W | 1980 W |
| Scenario | Common Load | Suggested Headroom | Watch Item |
|---|---|---|---|
| Router, ONT, Wi-Fi | 25 to 80 W | 15% | Small UPS runtime, not VA capacity. |
| NAS plus switch | 90 to 250 W | 20% | Disk spin-up surge. |
| Mini PC cluster | 120 to 450 W | 15% | Shared adapter or PDU limits. |
| 1U or 2U server | 250 to 750 W | 20% | PSU redundancy and fan ramp. |
| PoE access layer | 90 to 740 W | 20% | PoE budget plus switch draw. |
| Power Path | Input Spec | Real-Watt Limit | Comparison Use |
|---|---|---|---|
| UPS nameplate | VA and W | Use lower watt limit | Compare load against both ratings. |
| ATX PSU label | DC watts | AC draw is higher | Divide DC load by efficiency. |
| Inverter label | Continuous and peak | Continuous for 24/7 | Peak only covers startup events. |
| Rack PDU | Volts and amps | Volts × amps | Leave room for added gear. |
| PoE switch | System and PoE W | PoE budget is separate | Add switch base draw to PoE load. |
When the power flickers, you have a UPS to ensure your server stays on. It says 1000 VA on its label. That’s plenty of power for a home lab, right? So you plug in your mini PCs, switch, and NAS, feeling confident that it’ll all be OK. And then the lights go off and everything shuts down.
Why? Because you confused apparent power and real power. Real power measures how much power you’re using; apparent power measure how much electricity flows. The difference between these two figures is the power factor, and it tells you if your backup system will work or not.
Why Your UPS Fails: Real Power vs Apparent Power
Some loads aren’t created equally. Heaters (resistive) has a power factor close to 1, meaning they will convert almost every volt-amp into a watt that is doing some good. Electronics? Not so much. Servers with switching power supplies pulls current in these brief spikes and decrease their power factors.
Plug your actual load and estimated power factor into this calculator and let it do the work for you. You will no longer have to guess about your remaining headroom. Eliminate marketing hype of large VA numbers and see exactly how many real watts you get after efficiency loss.
Even if your hardware is moddern enough to have an active power factor corrected power supply (i.e., greater than 0.95), it’s still doing something with your electricity: extracting more actual power per unit of apparent power. A budget power supply or older model could be down as low as 0.6. Wasting almost half of what you’re paying for.
This is where most people go wrong. They look at the massive number on the back of the UPS and think, “I have X watts.” They don’t realize that inefficiency are taking a cut of that power internally. Then there’s also the fact that nothing ever gets converted perfectly, i.e., conversion efficiency is never 100 percent. That’s another multiplication in how much power is left over after accounting for all of this. The tool does all those multiplications for you so you can concentrate on whether your load will fit inside leftover capacity.
It’s a bit of a double-whammy when startup surges are involved. Motors, hard drives (anything with moving parts), pull much higher amps when starting up compared to running continuously. So if you’re already maxed out at your UPS’ capacity with constant loads any kind of startup surge might trigger the overload feature. That’s why you’ll often read about keeping your continuous load under 80%; to have some leeway for spiking without popping the fuse or draining the battery. Having a little breathing room helps.
You’ll see from the reference table on the page how various kinds of equipment behave in this situation. Hopefully this will help you know where to provide the cushion. This also relates back to our discussion on efficiency. The more efficient it is, the fewer watts are lost converting energy, which means that all of those wasted watts become heat, heat you’ll have to contend with in your room.
Even mild amounts of waste power in a closet-sized server rack or a small office will increase the temperature of that space. That heat could be shortening the lifespan of components or throttling their performance. Converting watts to BTUs lets you visualize that thermal load in terms you’re used to when planning for heating and air conditioning.
Remember: Devices use electricity to do work but also generate heat. Your power system isn’t the only thing with limitations. Remember, this isn’t a formula; it’s not something to memorize. It’s a reminder about the constraints that shape your infrastructure. Next time you see the label on an inverter or PDU, ask “what would of happened if all my devices pulled max power at once?” And then look again: Is the sum of everything well below the real-watt ceiling? Is it also far below the volt-amp rating?
There’s no penalty for purchasing a bit extra capacity to cover expected needs. The downside of underestimating gear requirements is a steep one: downtime. If you get it right, you will understand that the number on the sticker doesn’t always match how the plug actualy works. Treat the VA rating as potential… Not promise. Keep the lights on so you can finish saving your work.