HomeServerBlog startup current planner
Inrush Current Calculator
Estimate rack startup peak amps, steady current, pulse energy, staggered overlap, breaker headroom, and trip-risk signals for servers, NAS shelves, UPS inputs, switches, and mixed home lab devices.
★Device startup presets
⚙Startup current inputs
Current and energy breakdown
Stagger and breaker breakdown
▦Live startup markers
Devices inside the inrush pulse at the worst instant.
Elapsed time from first command until last pulse ends.
Peak apparent load at the selected voltage and phase.
Rough thermal stress proxy for the modeled startup group.
⇄Mitigation comparison grid
📋Inrush reference tables
| Type | Peak factor | Pulse shape | Planning note |
|---|---|---|---|
| Active PFC PSU | 1.00x | Moderate | Common server PSU input with controlled charging but still visible startup current. |
| Bulk capacitor | 1.25x | Sharp | Capacitor charging can create a high first half-cycle peak. |
| Transformer | 1.45x | Heavy | Magnetizing current can be high and sensitive to switch-on phase angle. |
| Motor load | 1.60x | Longer | Fans, blowers, and pumps can hold high current longer than IT supplies. |
| Soft start | 0.55x | Controlled | Sequenced or limited inputs reduce both peak and breaker stress. |
| Peak ratio | Pulse duration | Planning band | Action |
|---|---|---|---|
| Under 125% | Under 250 ms | Comfortable | Usually fine when steady load also fits the derated breaker limit. |
| 125% to 250% | Under 500 ms | Watch | Check breaker curve, UPS transfer behavior, and real startup measurements. |
| 250% to 500% | Any pulse | Tight | Stagger startup or reduce the number of simultaneous devices. |
| Over 500% | Any pulse | High risk | Use a different circuit plan, soft start, or manufacturer curve review. |
| Device group | Typical steady amps | Typical inrush | Suggested delay |
|---|---|---|---|
| Router, modem, small firewall | 0.2 A to 0.8 A | 2x to 5x | 50 ms to 150 ms if controlled. |
| 1U server with SSDs | 1 A to 4 A | 4x to 9x | 150 ms to 500 ms between hosts. |
| Disk shelf or many HDDs | 2 A to 8 A | 6x to 14x | Use drive spin-up groups where possible. |
| UPS charger or rectifier input | 4 A to 15 A | 2x to 6x | Delay rack loads after utility returns. |
| High-PoE access switch | 1 A to 5 A | 2x to 6x | Stage PoE port power after switch boot. |
| Delay vs pulse | Overlap | Best use | Tradeoff |
|---|---|---|---|
| 0 ms delay | All devices | Unmanaged power strip startup | Highest peak current and breaker stress. |
| Delay below pulse | Partial overlap | Fast scripted starts | Reduces peak but not as much as full spacing. |
| Delay near pulse | About one device | Managed PDU outlet sequencing | Longer boot span, strong peak reduction. |
| Delay above pulse | One device | Disk shelf and UPS recovery | Lowest peak but slowest full startup. |
💡Two inrush current tips
Turn on the switch. An LED blinks. Blackout everywhere. That’s what happens to too many people. Maybe you’re standing in front of your server rack trying to get a new storage array online, instantly, the main breaker trips. It is not a short circuit. It is not a hardware failure. It is simply an instant demand for capacitors firing up simultaneousy. This is inrush current. It kill your uptime in home lab.
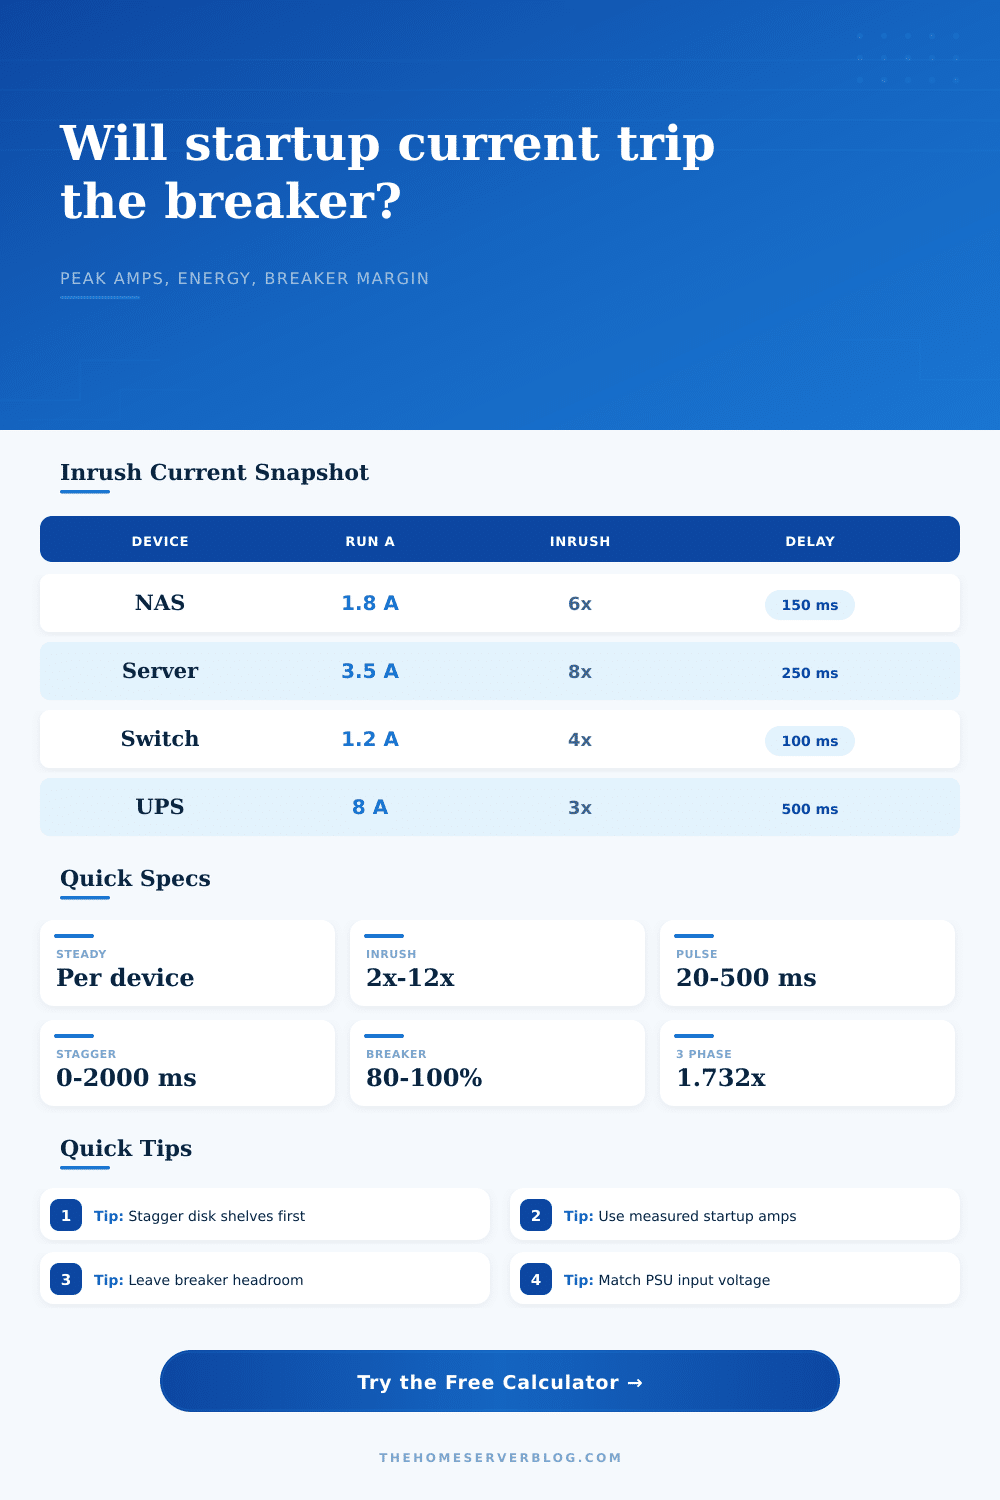
If most of us look at our power supplies and see a nameplate rating of say, two amps steady load, we assume that’s the calculation. We assume the calculation is done. Wrong. At startup, surge can be as much as six times greater than steady state. It only lasts milliseconds, yet it contains enough thermal energy to trip before the fans even has time to turn on.
How to Stop Your Power Breaker from Tripping
Plug in your number of devices and your chosen delay setting to this calculator; it’ll do the math for you. That means no guessing about breaker curves and pulse overlap. More importantly, inputs matters as much as they seem to. Your stagger delay is an input that determines how many device fire at any one time. Set that to zero and all units fire together. The combined peak has the potential to exceed a typical breaker’s instantaneous trip.
Even if you don’t trip the breaker, thermal stress on the contacts over and over age them prematurely. Setting up a staggered start a few hundred ms apart will spread out that spike of energy in time. A sharp shock becomes a manageable wave.
It makes all the difference what kind of power supply you have. Newer servers with active power factor correction is better behaved than older linear ones, but even so, they will suck in a lot of current when first turned on. Large capacitors in your electrical system (or transformers in any load) will also cause sharper spikes. See table of references on the page.
Using a soft-start controller can reduces that peak almost in half. That’s a huge relief for the grid. To get the same benefit, you don’t have to swap out hardware. You can make devices take turns by simply using sequencing through a managed power distribution unit. This small change in operation provide huge electrical benefits.
The second layer is the steady-state load. Once all your devices are up and running, there’s a certain amount of current constantly flowing through them. That’s not the initial boot-up mayhem, it’s just what they use while running. In our example, if the sum total of those steady loads takes up 80% of your breaker rating… well, then you’re screwed. Turn on another light in that circuit, or have your fridge kick on momentarily, and poof. Game over.
The tool will report both the sustained (steady) load and also the momentary peak load. That means you get the full picture. And you should of be able to see both. A low steady load but a high peak is annoying. A high steady load but a moderate peak is a fire hazard waiting for a heatwave.
There’s also three-phase power as a lever. Upgrading from 120 volts to either 240 or 208 volts lowers the line current while keeping the wattage constant. Less current means fewer breaker trips and less stress on your wires. Simple physics. It is the same amount of energy with less friction.
Many home builders fail to realize that unless they’re already troubleshooting breaker trip problems. It is a much simpler solution in the planning stage.
Estimation is no substitute for measurement. Presets are nice but measuring one actual device with a clamp meter that has inrush capture is a factor that can be plugged into the model. Then stagger it. See how much peak drops. Repeat. Over time this turns anxiety into data. No more guesswork about if the rack will survive the next reboot. Know.
Because it’s not just that you want the lights on, it’s that you don’t want your digital world to go poof when you plug it into the wall. And yes that first surge is going to happen. Engineering means learning to manage it.