MTTR Repair Time Calculator
Estimate detect-to-restore time, SLA exposure, bottlenecks, and monthly availability impact for servers, NAS, network gear, and home lab services.
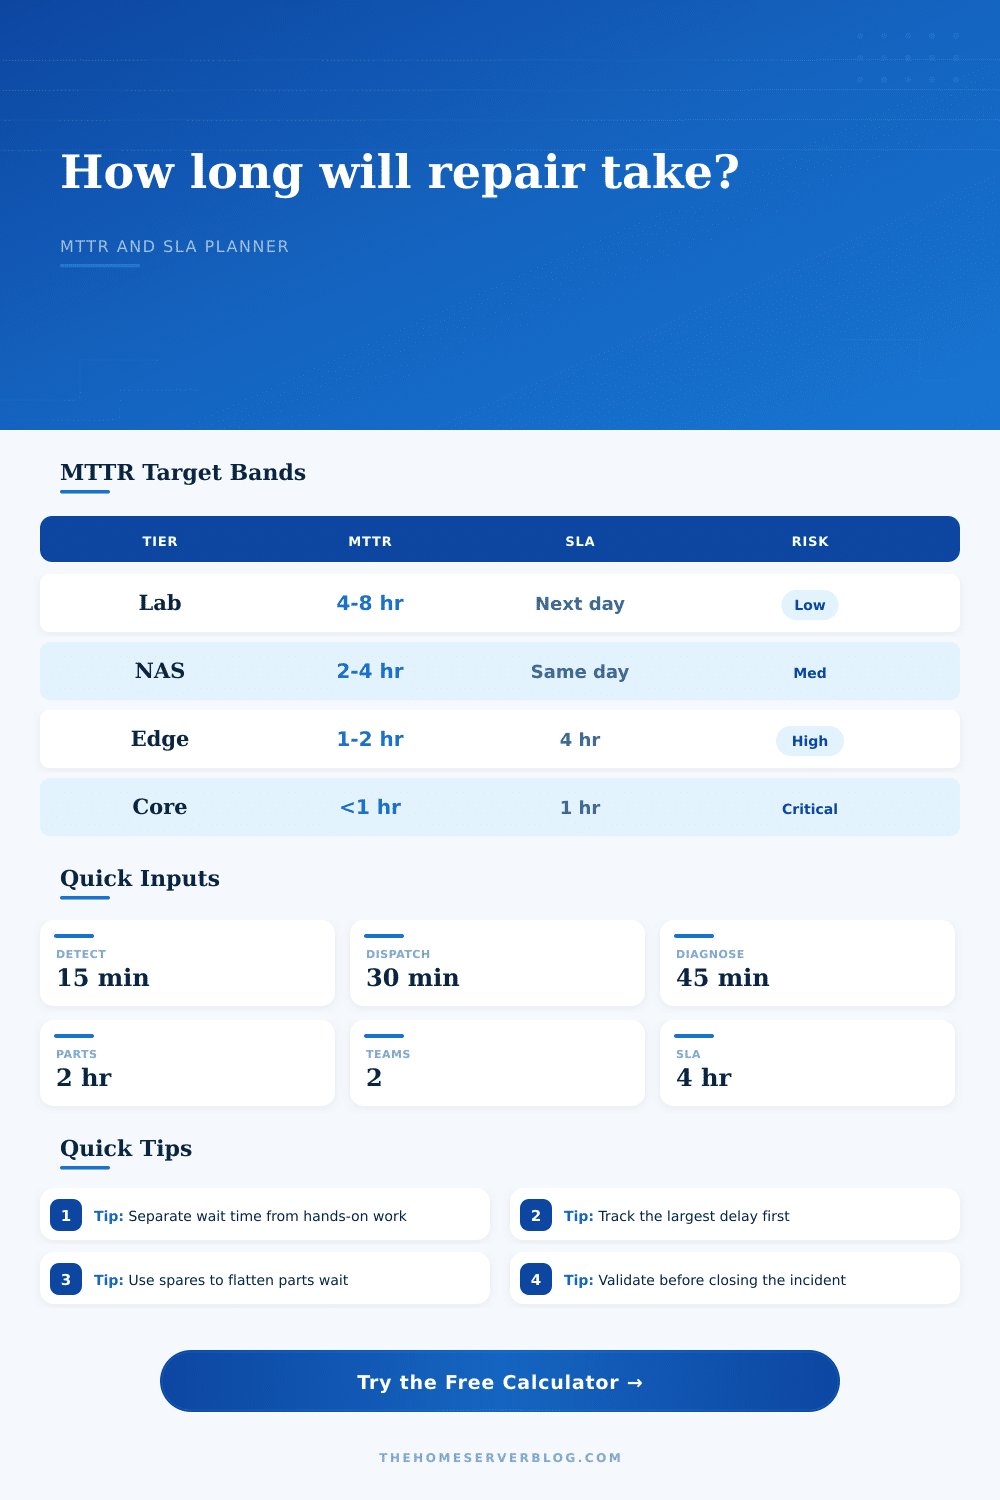
| Service tier | Typical target | Healthy repair posture | Warning sign |
|---|---|---|---|
| Sandbox lab | 4 to 8 hours | Documented rebuild path and backups checked weekly. | Every fault starts with searching old notes. |
| Family NAS or media | 2 to 4 hours | Spare drive bay, SMART alerts, and tested restore steps. | Replacement parts are unknown or not labeled. |
| Network edge | 1 to 2 hours | Exported firewall config and spare router or rollback image. | Internet outage blocks access to the fix instructions. |
| Core services | 30 to 60 minutes | Replica, failover, or cold standby already staged. | One host failure stops DNS, auth, and storage together. |
| Stage | Lean range | Common range | How to reduce it |
|---|---|---|---|
| Detection | 1 to 10 min | 15 to 60 min | Alert on service checks, not just host ping. |
| Dispatch | 5 to 20 min | 30 to 120 min | Define owner, escalation, and remote access path. |
| Diagnosis | 15 to 45 min | 1 to 3 hr | Keep diagrams, labels, baseline metrics, and recent changes. |
| Parts wait | 0 to 30 min | 2 hr to days | Stock the small spares that block big restores. |
| Validation | 10 to 30 min | 30 to 90 min | Use a short acceptance checklist for each service. |
| Severity | Example | MTTR target | Best control |
|---|---|---|---|
| Critical | WAN edge, DNS, auth, storage pool offline | 1 hour or less | Failover path and known-good config restore. |
| High | Main NAS degraded, hypervisor node down | 2 to 4 hours | Spare hardware and clear rebuild checklist. |
| Medium | Single AP, media service, backup target | Same day | Monitoring plus planned maintenance slot. |
| Low | Lab VM, test cluster, noncritical dashboard | Next day | Backlog triage and repeatable rebuild notes. |
| Visible MTTR | 1 incident/mo | 3 incidents/mo | 30-day availability |
|---|---|---|---|
| 30 minutes | 0.5 hr | 1.5 hr | 99.79% to 99.93% |
| 2 hours | 2 hr | 6 hr | 99.17% to 99.72% |
| 4 hours | 4 hr | 12 hr | 98.33% to 99.44% |
| 8 hours | 8 hr | 24 hr | 96.67% to 98.89% |
It’s 2 am and the dashboard turns red. The media server shuts down. Why won’t Netflix buffer? You know how to fix it… if only you could find a spare drive, log into the router, and locate the correct cable.
Downtime lives in that space between the alert and the return of service. It is not because you can’t type fast enough. It is because you haven’t planned for friction between what you want to do and what your hardware allow you to do.
How to Fix Problems Faster
You’ll need to know how to interpret inputs to the calculator, i.e., what they mean in your environment. Repair time isn’t just the minutes it will take to reboot a system, or replace a drive, which is what most folks believe. It’s a trap. It’s those invisible delays that realy get you.
Because your alert checks if the host is still alive rather than checking whether the service itself is healthy, detection time can be long. Ping doesn’t tell you your database is corrupt even though the server is still on.
Likewise, dispatch time are ignored. You’re the only one on call? Then you own that ticket. You gotta get out of bed, reach over, find your phone, and crack open a remote session. Thirty minutes add up quickly.
And then there’s the parts wait. That’s typically bottleneck in home labs. If your logs is clean, you can diagnose in minutes. If the part is on the shelf, you can fix it in minutes. But if you’re digging around in a closet for power supply or waiting for that RMA shipment, the clock continues to tick.
The tool lets you slice this up. They cannot be fixed all at once. It’s important because you need to target largest delay. If waiting for parts takes up most of your timeline, the only move is to buy spares. If diagnosis slows things down, you’ve got some lack of documentation going on. The calculator help you identify which lever to pull.
Add redundancy to the mix and it’s completely different. No, it doesn’t make repairs go away. For instance, your service stays up through a drive failure on a clustered setup, but someday you still need to replace that drive. The thing is, you’ve got days rather than minutes to do so.
This is where that availability impact metric come in handy. It expresses your repair time as a number of hours of downtime per month. Two incidents a month with a four-hour MTTR? That’s substantial loss right there. Four hours are an entire movie night lost each week.
Sound abstract? People underestimate value of support models. When you’re away, DIY becomes problematic. An undervalued form of insurance is having a friend who’s comfortabley with power cycling a piece of gear or reseating a cable. That covers the time between when you call for help and when it arrives.
The page has those reference tables that plot it all out: tier by tier where you expect what. You move from a “sandbox experiment” to a “core family server.” A core family server doing authentication and DNS requires an expectation of less than an hour, while a sandbox running for an hour or eight doesn’t realy matter. Knowing where you sit helps keep your expectations in check so you don’t over-build out a test VM or under-prepare for full-on NAS.
Everybody skips validation. Fix the thing, make the lights go green, close the ticket. Did you check the backup? Did you verify replication? Skipping validation transforms a five minute fix into a six hour data loss event. It is a small thing, yes. It is not a matter of course. That’s why there is an input in the calculator for validation. It forces you to factor in that last check. That isn’t pessimism; that’s planning a buffer.
Things go wrong. Configs fail. Cables get stuck. Add ten or twenty percent to your estimates to account for unknown things happening in your stack. It prevents you from saying “I’ll have this fixed by ________” when you actualy can’t.
In conclusion: Making your MTTR go down doesn’t mean typing quicker. It means reducing the number of steps needed to send an alert. If you’ve got runbooks and spares sitting on the shelf, you’re boring yourself into a fix. And boredom is good. It’s because if you get woken up in the middle of the night with a blinking red light…you’re already there. You should of prepared for this.