HomeServerBlog reliability planner
MTBF Series System Calculator
Estimate system MTBF for a pure series system where every required component must work, using component count, component MTBF, component categories, duty cycle, environment derating, annual operating hours, mission time, repair policy, and confidence factor.
1Series system presets
2MTBF, mission, and operating inputs
Series MTBF breakdown
Reliability health indicator
3System reliability cards
Failures per billion operating hours after series summing and derating.
Steady-state estimate using selected repair policy MTTR.
Expected repair time from annual failures and MTTR.
Category contributing the largest share of series failure rate.
4Component comparison grid
Storage devices
Drives often dominate count and workload stress in NAS and backup systems.
-Cooling fans
Fans are mechanical parts; dust and heat can make their practical rate worse.
-Power path
PSUs, power bricks, and UPS-facing parts can be single points in a series path.
-Control and compute
Motherboards, CPUs, NICs, HBAs, and switches form the active logic chain.
-5Reliability reference tables
Mission reliability table
| Mission window | Reliability | Failure chance | Expected failures |
|---|
Component count sensitivity
| Series parts | System MTBF | Annual failures | Mission reliability |
|---|
Environment factor guide
| Environment | Factor | Typical place | Reliability clue |
|---|---|---|---|
| Benign room | 0.8 to 1.0 | Clean office, stable temperature | Best baseline |
| Home rack | 1.0 to 1.3 | Closet, garage-adjacent utility space | Watch intake temperature and dust. |
| Warm closet | 1.3 to 1.8 | Restricted airflow or summer heat | Fans, drives, and PSUs age faster. |
| Harsh edge | 1.8 to 3.0 | Attic, shed, vibration, dirty air | Use field data and spares. |
Repair policy table
| Policy | MTTR used | What it changes | What it does not change |
|---|---|---|---|
| No repair | Mission only | No availability credit during the mission | Series no-failure reliability. |
| Hot-swap stocked | 2 hours | Expected downtime after a failure | Initial chance of a failure. |
| On-site spare | 8 hours | Availability after diagnosis and swap | Component failure rate. |
| Vendor RMA | 120 hours | Downtime exposure and risk planning | Series MTBF itself. |
6Series MTBF tips
No one wants to watch their home server die in the middle of the night…you built it so that you could have control over it. And there’s always that quiet tension with every self-hosted solution. You connect the cables. You stack the components. And you pray it doesn’t die.
Reality tend to spoil the fantasy. Thankfully, the MTBF series system calculator (above) will do all the heavy math for you. It’ll take a list of parts and turn it into an honest probability of surviving.
How to Calculate Your Server’s Risk of Failure
How? It treats your entire stack as a single chain: each component is a link that matters. Break one, and the mission are over. This is the brutal math of series reliability.
People see an MTBF rating on a power supply or a drive and think “this is a guarantee.” Nope. It’s a statistical average, based off lab conditions that is unlikely to resemble anything in your warm garage or dusty closet. The calculator makes you think about what the difference is between a data sheet and a deploy.
How many component do you have? What’s their typical MTBF? Then how about the environment factor? That is where it gets interesting.
If you’re in a nice, cool, air conditioned office room, maybe your multiplier stays close to one, but if you’re in a hot, dusty shed, it could easily get up into the three range. And a triple doesn’t make your wait times longer, it triples the failure rate. Because all the failures compound, the system fails more faster than any individual part would suggest.
But what about duty cycle setting? I mean, how do you know if a 24×7 server should be treated different from a weekend media box? That’s where the equation comes in. Each additional hour of operation adds another hit. It is not just about parts, but also the level of exposure.
A confidence factor is required here too… Or rather, it’s your own hedge against the unknown. Is this a set of brand new enterprise drives or did you pick up some refurbs at an auction surplus? The aging factor lets you adjust for that wear. Older capacitors leak and older fans seize. There’s a way to dial that in as well with age of device.
The calculator doesn’t speculate, it would of wait on you to determine your level of caution.
If you’re going to use this for planning (such as for a live stream or some kind of backup window), what’s most helpful is its output for mission reliability; the chance that absolutely nothing will break in your planned time frame. And if you want to figure out how much inventory to plan for, that’s where annual failures come into play. If the tool says there’ll be two a year, then yeah, you want spares. Zero? You might just get lucky, but still check the weak spots.
What does it tell you about why it thinks something has a low reliability? That’s right, look at breakdowns. Look at that breakdown panel. Those usually is the mechanical things. Drives spin. Fans spin. They eventually wear out. Solid state things don’t last forever. But they do last longer.
It’s a common temptation when dealing with a complex system like this to think that “it all just balances out”. And redundancy is the answer! That assumption is what shuts off redundancy in this calculator: it assumes a simple series path. In reality, if you’re using redundant power supplies, that’s a separate issue altogether. The point of this tool is to strip that out, so that you can see how fragile the active path is.
This is for diagnostics, not for specifications. You run this to find the weak link before something goes down. Swap out drives if it’s the storage category killing your reliability score. Upgrade airflow or clean the filters if its the cooling fans doing it.
This does not mean achieving perfection. Perfection is a myth. This means knowing what your risk is so you can control it. Yes, you’ll always have your weakest link. The art is in ensuring it isn’t the weakest link that brings down the entire thing.
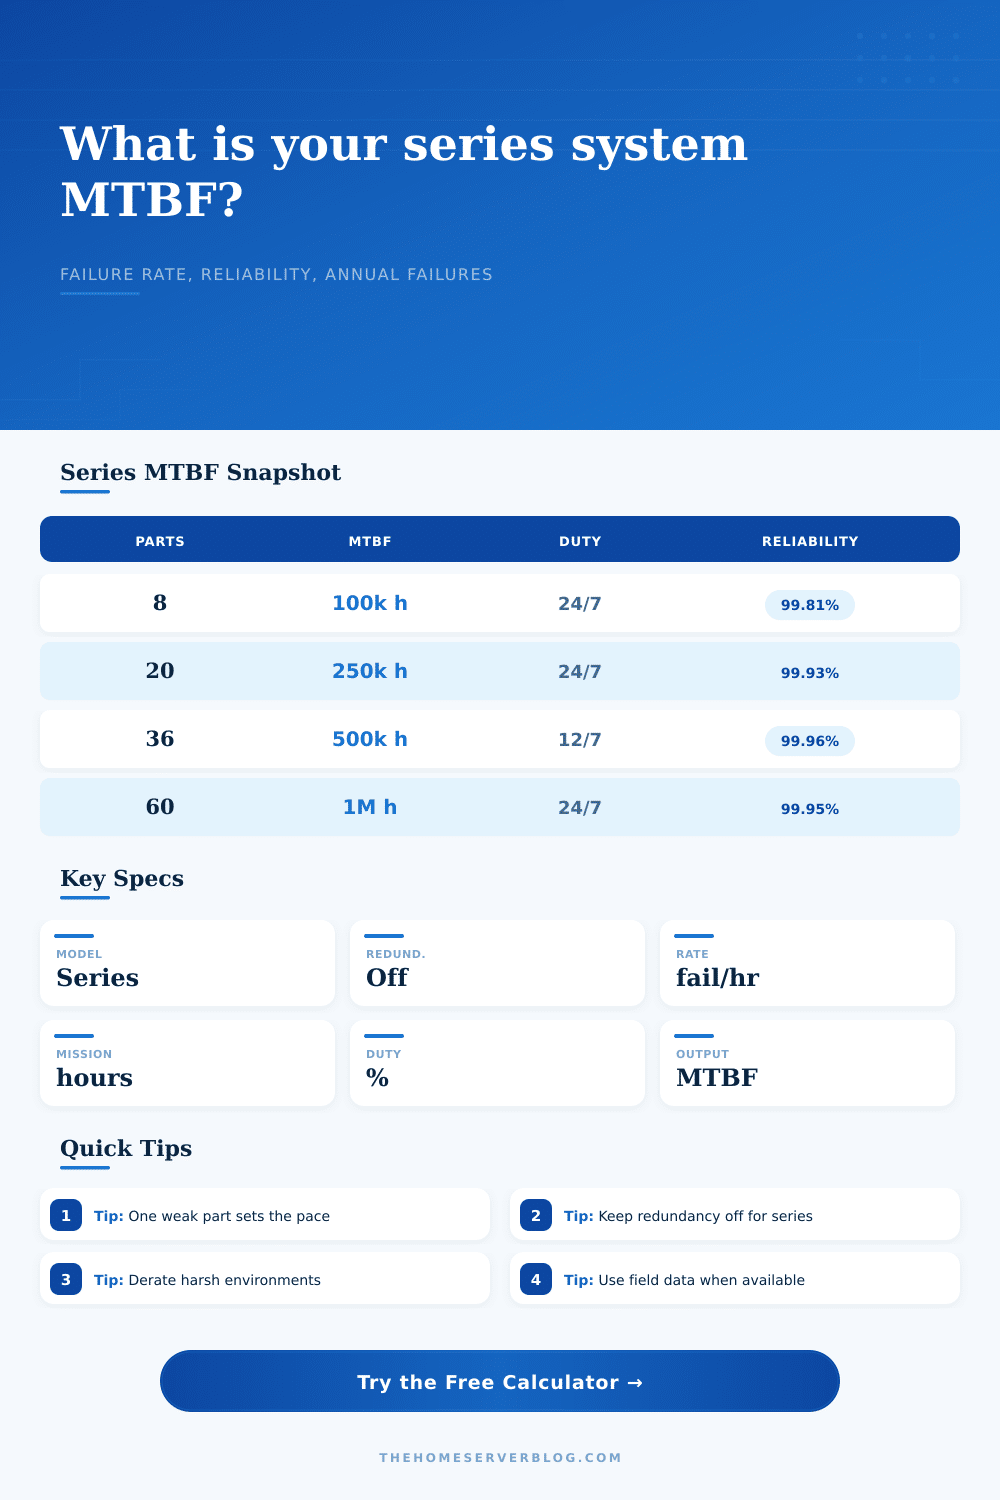
Refer to the reference table and notice how fewer components reduces risk. Each additional component increases the number of ways this thing might fall apart. It’s dead simple. It’s counter-intuitive. It’s absolutly correct.
Build the thing. Measure its risk. Prepare yourself for failure. The machine will work. The machine will break. Half the fight is knowing when and where.