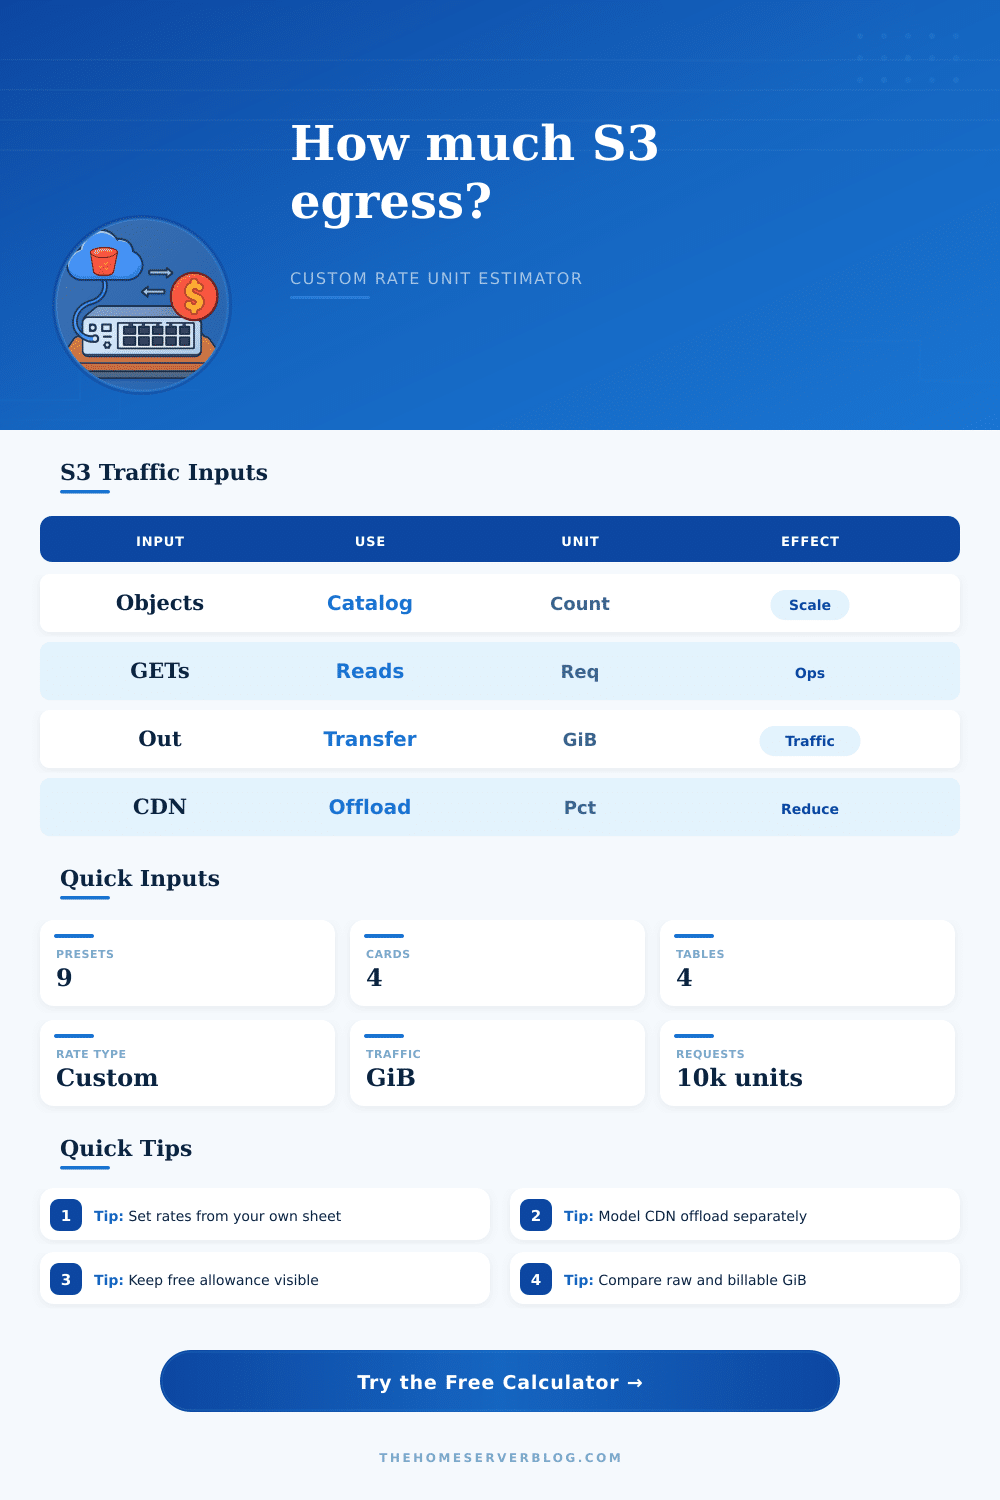
AWS S3 Egress Cost Calculator
Estimate S3 transfer-out and request impact with your own rate units, object profile, lifecycle factor, compression, CDN offload, and allowance assumptions.
Enter rates in any internal unit you use. The calculator does not include fixed provider amounts or default currency examples.
Calculation breakdown
| Workload pattern | Dominant input | Common pressure | Best sensitivity check |
|---|---|---|---|
| Static site assets | Transfer out | Cache misses | CDN offload change |
| Software mirror | Large objects | Download spikes | Average object size |
| Analytics export | Batch GiB | Scheduled pulls | Allowance threshold |
| Media application | GET volume | Small object reads | Requests per 10k |
| Adjustment | Input range | Calculation effect | Use when |
|---|---|---|---|
| Compression | 0% to 95% | Reduces bytes sent | Objects compress well |
| CDN offload | 0% to 100% | Reduces S3 origin egress | Edge cache serves hits |
| Free allowance | Any GiB | Subtracts from adjusted GiB | Credits or commit apply |
| Lifecycle factor | User selected | Weights adjusted traffic | Tier mix differs |
| Rate input | Base unit | Formula used | Result bucket |
|---|---|---|---|
| Transfer rate | Per TiB | Weighted GiB / 1024 | Transfer units |
| GET rate | Per 10k | GET requests / 10000 | Request units |
| Rate unit label | User text | Display only | Output label |
| Total estimate | Custom unit | Transfer plus GET | Monthly total |
| Preset | Object style | GET behavior | Traffic note |
|---|---|---|---|
| Static Site Assets | Many small files | High cacheable | CDN sensitive |
| Backup Restore Test | Few large archives | Low GET count | Allowance sensitive |
| ML Dataset Pull | Large objects | Batch reads | Tier factor sensitive |
| Mobile App Media | Mixed media | Frequent reads | Compression sensitive |
The story begins innocently enough, some kind of internal dashboard, a portfolio site, etc. Soon you find yourself parking your stuff on S3 because it’s cheap. It’s resilient! It’ll scale! And the bill won’t blink for the first couple month.
It stays manageable until that one viral post, or maybe until some misconfigured bot scrapes your images at 3am, at which point the price of transfer overwhelms the cost of storage by a factor of ten. That’s a jarring experience, but it’s completely avoidable when you know how request volume actualy compares to egress pricing. Remember: even if nobody beyond your own organization is retrieving this data, moving it somewhere costs money too. The above calculator does the math for you.
How to Save Money on AWS S3 Costs
With just a little poking around, you can input your actual traffic patterns so you don’t have to guess at coefficients and tier boundaries. What it’s really about: When you’re trying to figure out how much data you need to store, the first thing you wrestle with is not the amount of data but rather the number of times that it needs to move vs. It is the number of times you ask for it. Maybe you have a giant dataset that hardly moves, or maybe you’ve got tiny little thumbnail images that get pulled millions of times an hour. At scale, those two scenario appear exactly alike when you just stare at gigabytes of storage.
To let you separate these concerns, the tool allows you to separately define your average object size, object count, and number of GET requests per month. Why? Because AWS will charge you both for the bandwidth used to transfer your data as well as for each HTTP request made. For example, if you’re serving up thousands of small files, the cost of the requests can dwarf the cost of the bandwidth. It’s one of those unexpected traps that many engineer fall into, focusing exclusively on terabytes without worrying about the extra cost of making lots of small reads.
What about what comes out of that bucket? That’s where your CDN offload input becomes your best friend. If you’re sitting behind some other edge cache like a CloudFront distribution, S3 doesn’t see each and every user request. It asks for your estimate of cache hits, i.e., how much traffic never even touches your origin bucket? For example, if you have a very high cache hit ratio, then your S3 bucket in Virginia sits quietly idle as the majority of your users got their content from a server in Singapore or London. This dramatically reduces billable transfer volume. Changing this percentage allows you to model different scenarios and see how sensitive your costs are to caching efficiency.
Another frequently overlooked tool is compression. Sending an uncompressed file (whether JSON), text, or even JavaScript, is wasting money on bytes that could be significantly smaller with encodings like brotli or gzip. There’s a compression reduction field, so you can get a sense for how much smaller you might make your payload before it leaves your server. It doesn’t actualy compress things for you (that’s left to your delivery pipeline), but allows you to gauge the benefit of optimizing. If you’re running a static site, this is particularly important because each kilobyte you shrink reduces both cost and latency.
Secondly, think about how your data lives (lifecycle). All egress isn’t equal. Moving some data will cost much more then others, depending on its lifecycle tier. For example, restoring an object from Glacier Deep Archive will cost many times as much per GB as getting one back from regular storage. However, if it’s cold data, putting it into Glacier in the first place may save you money on holding costs. The lifecycle factor input lets you weight traffic according to where your objects actualy reside. Maybe you get a lot of traffic hitting standard storage, and then do a big batch export that pulls from your infrequent access tiers. Blending these factors helps give a more realistic estimate than just assuming it’s all premium standard.
Last but certainly not least, don’t neglect your dedicated data discount or free allowance that may be applied to your account. This discount is taken off up-front and will reduce the billable amount before we figure out your rates. You’ll see that we take this into account so that you know exactly what you’re on the hook for after discounts. When trying to explain to management why you need to change infrastructure, those little things count.
To avoid starting from scratch each time, the tool includes reference tables that help you map common workload patterns against these inputs. So if there are any hidden fees lurking around S3, well it’s less about them then it is managing how you access that data. Break out your viewer traffic versus origin traffic; consider compression, caching and request density, and use all that to predict bills a lot better.
Ultimately you don’t need to cut every single penny. It’s more about making sure your infrastructure spending matches the value you receive. When you’ve got these tools in hand, then the surprise bill ceases to exist. If it makes your business go, you should of kept it parked in S3, and now you know why it costs what it does.