Bandwidth Utilization Calculator
Estimate average and peak network utilization, duplex load, headroom, transfer time, oversubscription, and upgrade risk for WAN links, NAS paths, VLAN trunks, VPN tunnels, and home lab backbones.
Formula Breakdown
| Scenario | Typical link | Healthy target | Watch closely when |
|---|---|---|---|
| Home WAN with video calls | 300 Mbps to 1 Gbps | Peak under 75% | Upload peaks create latency before download looks full |
| NAS backup or restore | 2.5G to 10G | Peak under 80% | Backup window overlaps streaming, VM migration, or snapshots |
| Virtualization storage | 10G to 25G | Peak under 70% | Latency-sensitive VM disks share the same uplink |
| Camera or telemetry VLAN | 1G access trunk | Average under 60% | Many fixed streams leave little burst capacity |
| Formula | Expression | Used for | Practical note |
|---|---|---|---|
| Effective capacity | capacity x efficiency | Usable Mbps after overhead | VPN, Wi-Fi, and tunneling reduce usable rate |
| Utilization | demand / capacity x 100 | Average and 95th percentile load | Use the busiest direction on full-duplex Ethernet |
| Headroom to target | capacity x target - peak | Remaining Mbps before the chosen ceiling | Negative values mean the link is past target |
| Transfer time | GB x 8000 / Mbps | Backup, restore, or sync window | Available Mbps is capped by headroom and efficiency |
| Link type | Nominal rate | Planning efficiency | Best use |
|---|---|---|---|
| 1 GbE copper | 1000 Mbps | 92% to 95% | Access switches, routers, cameras, and light servers |
| 2.5 GbE copper | 2500 Mbps | 90% to 94% | Wi-Fi 6 APs, workstations, and mini PCs |
| 10 GbE SFP+ | 10000 Mbps | 93% to 96% | NAS, VM hosts, backup targets, and lab cores |
| VPN tunnel | varies | 65% to 90% | Remote sites where CPU, MTU, and crypto matter |
| Wi-Fi uplink | varies | 45% to 75% | AP backhaul where airtime and retries affect capacity |
| Project size | Inputs to collect | Primary result | Secondary result |
|---|---|---|---|
| Small home office | WAN up/down, users, cloud sync | Peak WAN utilization | Upload headroom and video-call risk |
| Home lab rack | Server uplinks, NAS rate, backups | Backbone utilization | Backup window and fair share per host |
| Camera network | Stream bitrate, camera count, NVR path | Average trunk load | Room for more cameras or higher bitrate |
| Remote site VPN | Tunnel rate, users, file transfer size | Tunnel saturation | Transfer time and upgrade threshold |
This calculator is a planning aid. Validate important links with switch counters, router graphs, packet loss tests, latency under load, and realistic backup or restore runs.
Network performance issues can often be noticed by a persons prior to being represented on a network dashboard. Network performance issues may be noticed if video calls begins to stutter or if data back up takes longer then expected. Network performance issues may also emerge when a smart TV and a laptop are attempting to utilize the same amount of upstream bandwidth at the same time.
Each of these network performance issues emerge as utilization of the network have increased to a level that is uncomfortable for the network and to a level at which small bursts of data have the potential to create problems. In order to understand the concept of network utilization numbers, it is first important to understand that the numbers will not necessarily reflect the theoretical capacity of the network. For instance, a network with a one-gigabit capacity may only provide nine hundred available megabits because the need to send network data regarding Ethernet framing, TCP acknowledgements, VPN encryption, and Wi-Fi data retries consumes some of those megabits.
How Network Use Affects Speed
Thus, the capacity of the network of which the data is being sent is lower than the theoretical capacity of that network, and the available capacity for wireless networks is again even more limited than the wired network of which it is a part. These differences in available capacity must be accounted for in the determination of the level at which the network should be utilized. Average traffic statistics differ from those of peak traffic statistics.
Average traffic statistics will reflect the performance of the network during a typical hour, while peak traffic statistics will reflect the performance of the network during the busiest portion of the networks hours. Many networks will calculate peak traffic as the ninety-fifth percentile in order to reflect the number of devices that are using the network simultaneously. For example, a network may average thirty percent in its traffic statistics yet reach a peak traffic statistic of ninety percent.
Scheduling the network to accommodate peak traffic rather than average traffic will avoid performance issues on the network. An additional factor to consider is the traffic that is transmitted in each direction of the network. This factor is more important than many peoples may think.
For instance, full-duplex network links will use the direction of the network that is the busiest at any given time, but upload-constrained network links will not work in the same way. Furthermore, networks such as VPNs may act as if they are a single pool of available data that both the upload and download portions of the network use. Thus, it is important to take a look at both upload and download speeds of a network rather than just the download speed.
Data traffic is rarely all packed together. Instead, there are often unexpected events within the network. Thus, an understanding of how to provide for unexpected events within the network should be included in the consideration of available network capacity.
In addition to understanding the available data capacity of a network, calculations can be performed regarding the transfer time of the data. To calculate the transfer time, it is first important to understand the amount of data that must be transferred, as well as to understand the amount of data capacity that remains in the network. Given these two values, it is possible to determine whether the backup will occur prior to the morning or whether the synchronization of files will impact a meeting with those files.
Concurrent devices that are utilizing a network will change the performance of that network. For instance, a network that eighteen devices use at seventy percent of its concurrency will have different performance than a network that forty devices use at the same percentage of concurrency. This difference in performance is caused by the reduction of the amount of data that each device can use from the available data of the network.
Estimates of how this fair share of data can be provided to each of the devices is another consideration that may help a network manager in understanding the effect that the addition of any device will have upon the network. The different links within a network are used for different purposes. Thus, a one-gigabit access switch will not require the same amount of headroom as a ten-gigabit network that is dedicated to file sharing servers, yet both networks will have different headroom requirements than a VPN link that creates overhead data regarding access to the files in the network.
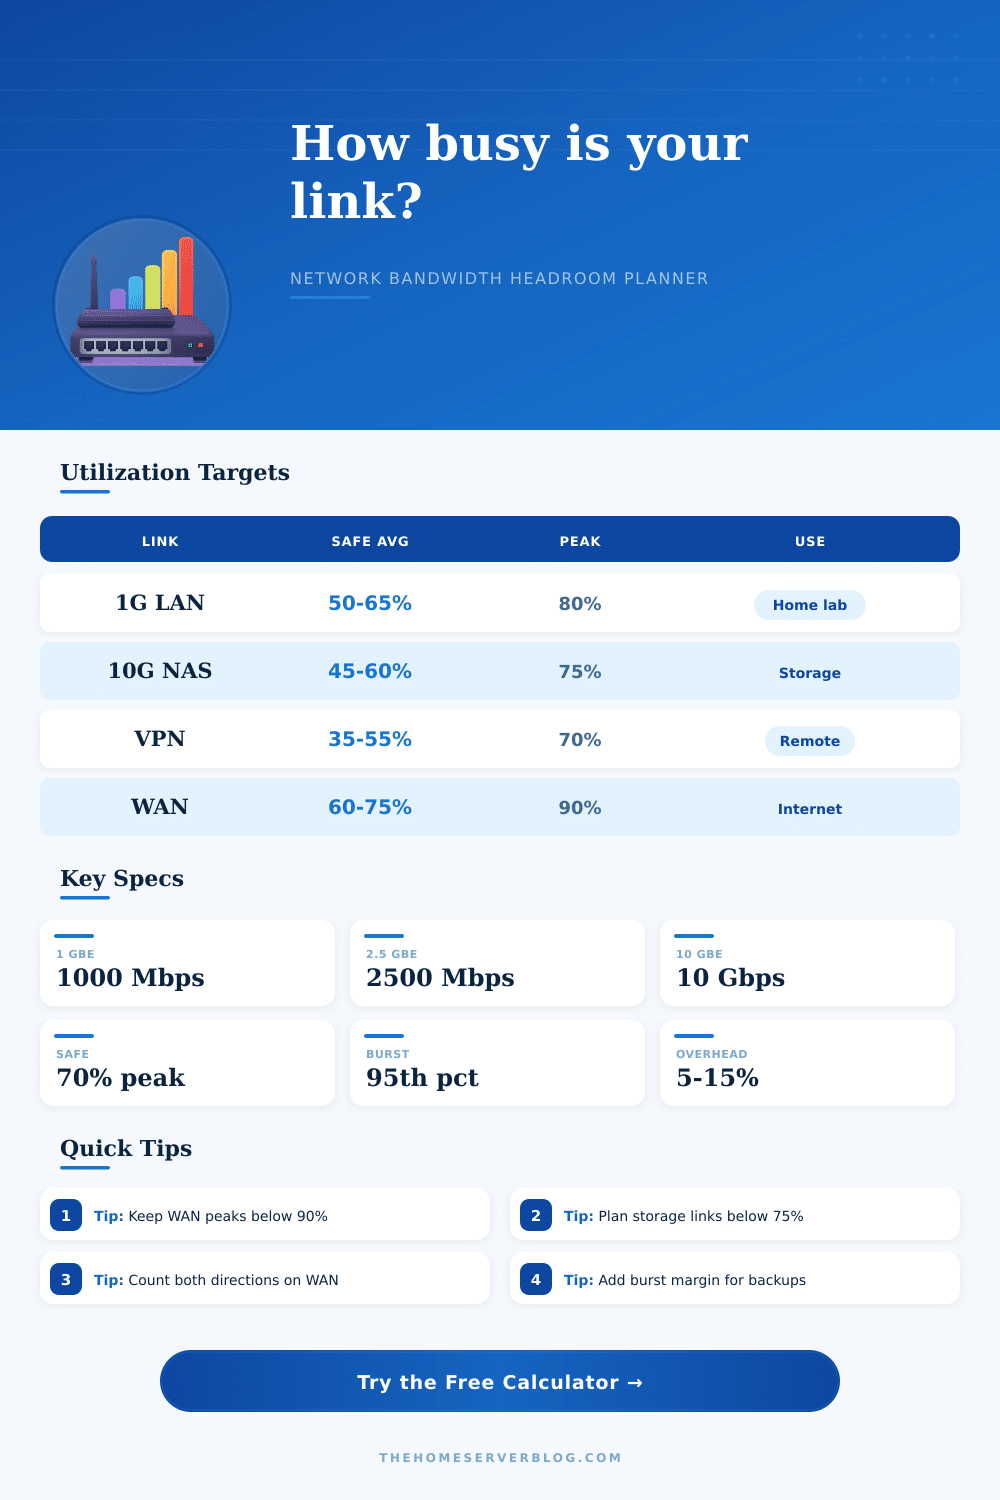
Reference tables can help to determine the amount of utilization that should exist within each of these scenarios. For instance, a seventy percent peak utilization rate may be implemented to allow for latency times to remain small for voice communication and video conferencing applications, while an eighty percent peak utilization may be permitted for scheduled data replication of files that occur during the overnight hours. The value of a network can be understood by comparing the measurements of network performance during different time periods.
For instance, a network that was functioning well during the last quarter of the year may experience difficulties during the current quarter due to the addition of new devices to the network. In these cases, it is important to monitor the utilization of the network prior to the emergence of the problems with the network. Such a step will allow a network administrator to better avoid network outages.
Rather than attempting to place each link in the network below a percentage of utilization, the goal is to understand the different points of pressure in the network and whether or not the structure of the network matches the amount of utilization of the files and data that is travelling along each link. In these cases, the manager will begin to trust the network.