Home lab database cache planner
Query Cache Size Calculator
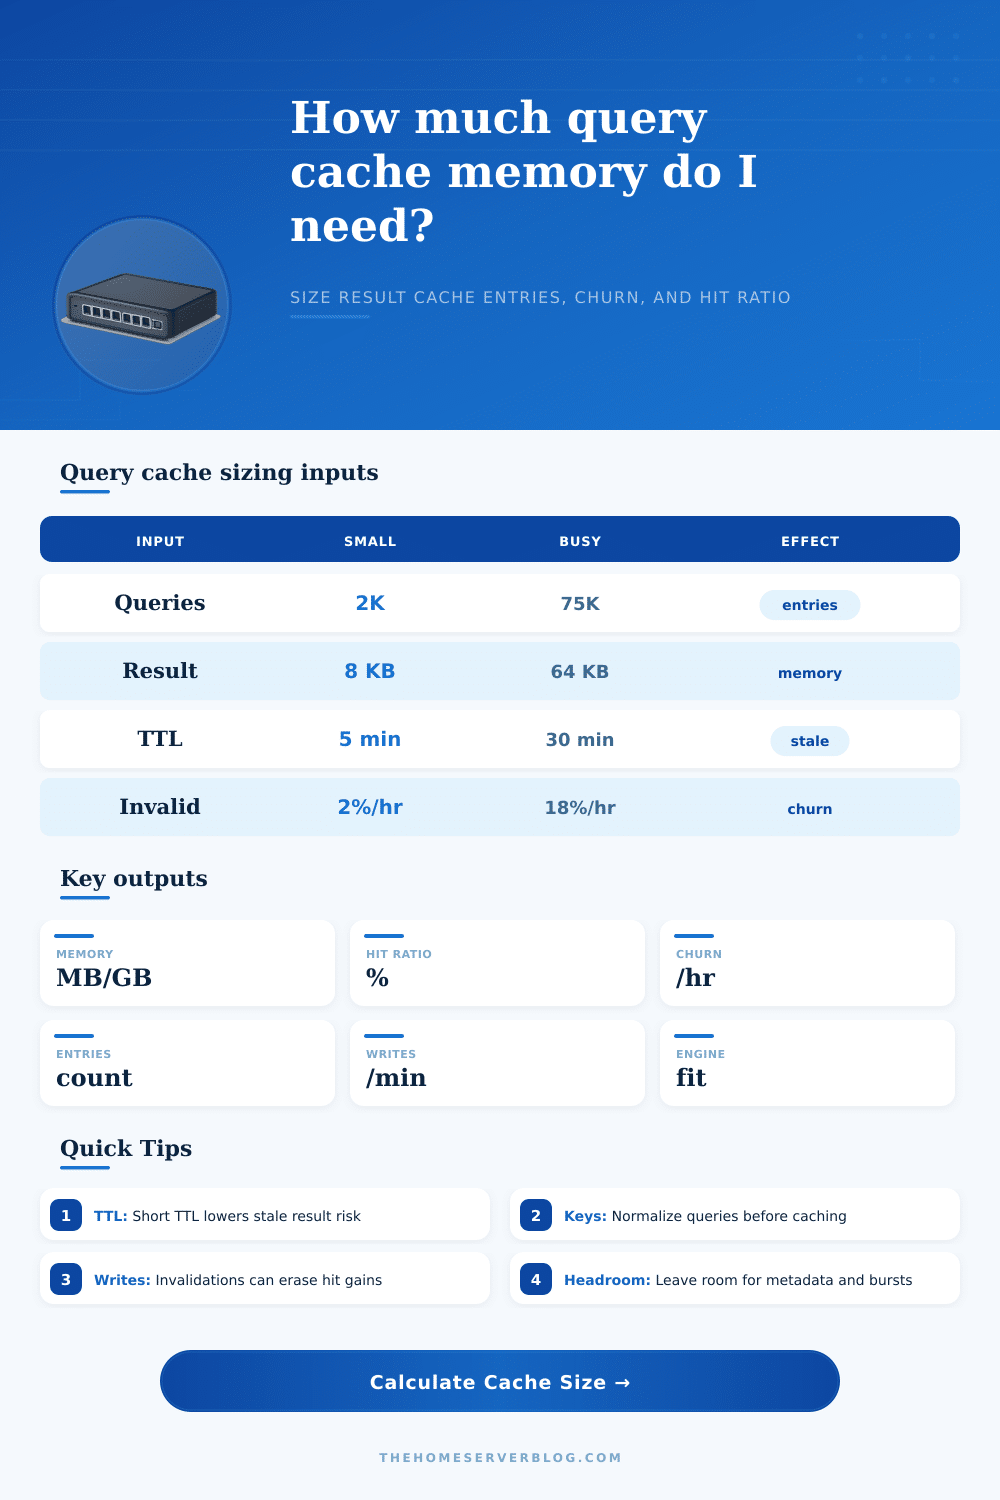
Estimate memory for cached query results, effective hit ratio after TTL and invalidations, churn per hour, write pressure, and the cache engine fit for your workload.
Calculation Breakdown
Engine Fit
| Engine | Best Fit | Strength | Watch For | Typical Policy |
|---|---|---|---|---|
| Redis / Valkey | Shared app cache | TTL, tags, scripts, clustering | Memory fragmentation and eviction choice | allkeys-lru or volatile-ttl |
| Memcached | Simple result blobs | Low latency and slab allocator | Item size limits and slab imbalance | LRU by slab class |
| In-process LRU | Single service hot keys | No network hop, fastest reads | Duplicate cache per instance | Size-bound LRU |
| CDN / Edge KV | Global read-heavy results | Very low user latency | Slow purge fanout and eventual consistency | TTL plus stale-while-revalidate |
| Database table | Durable shared cache | Simple operations and SQL visibility | Can compete with real database workload | TTL indexed cleanup |
| Workload Pattern | Entry Count | Avg Result | TTL Range | Common Risk |
|---|---|---|---|---|
| Admin dashboard | 500 to 5,000 | 4 to 32 KB | 30 sec to 5 min | Frequent refresh storms |
| Catalog or lookup API | 10,000 to 250,000 | 2 to 16 KB | 5 to 60 min | Tag invalidation volume |
| GraphQL resolver cache | 5,000 to 100,000 | 1 to 12 KB | 1 to 20 min | Key explosion from arguments |
| Analytics result tiles | 1,000 to 50,000 | 16 to 256 KB | 10 to 120 min | Large result blobs |
| Search result cache | 20,000 to 1,000,000 | 8 to 80 KB | 2 to 30 min | Long-tail miss rate |
Result cache sizing is usually driven by stored payload size, cardinality, metadata, and how quickly invalidations erase useful entries.
| Signal | Healthy Range | Warning Range | Action |
|---|---|---|---|
| Effective hit ratio | 70% to 95% | Below 50% | Improve keys, TTL, or cache only hot queries |
| Churn per hour | Under 25% of entries | Over 60% | Shorten scope, split volatile objects, add tags |
| Memory headroom | 20% to 40% | Under 10% | Raise maxmemory or lower entry count |
| Avg result size | Under 64 KB | Over 256 KB | Compress, trim fields, page large results |
| Miss write rate | Below origin write capacity | Bursting with traffic | Add request coalescing and jittered TTL |
There’s a problem with sizing a query result cache. It seems obvious right up to the moment you try to do it. You’ve got limited RAM and read traffic, so you’d like to shift some of the work away from database. So you add memory, until hit ratio appears respectable on paper. In production, that almost never goes well; it fail to account for churn. Churn means either invalidation (data is invalidated before you’ve served any cached results) or expiration (the data has expired by the time you serve it). And then you’re burning CPU cycles on a revolving door instead of actualy saving any database reads.
The trick is balancing payload size against useful lifetime, how long does the data remain useful before it’s stale? After plugging in how many results you want and what size each one is, the calculator do the math for you (above). And it prevents you from guessing your way around conversion factors and coefficients. It forces you to stare down at the price you paid to store each entry. Eight kilobytes may not sound like much in a serialized JSON response, but times that against fifty thousand unique key and you’re under serious memory pressure. Add in the metadata overhead of engine specific headers, expiration timestamps, and key metadata and your real memory usage scales up fast. Most engineers forget about the metadata tax until their eviction policy start thrashing. This calculator accounts for it: define the number of bytes per entry that are metadata and compression savings and you’ll have a realistic baseline vs. This is an optimistic theoretical minimum.
How to Choose the Right Cache Size
Most sizing exercises fail to account for time to live. Setting your TTL for when data could possibly change isn’t the same as setting it for when data tends to change. Serving up stale data doesn’t make sense if your dashboard refreshes every five minutes and you set a TTL of thirty minutes. Purging out useful entries unnecessarily makes no sense if your data only changes once per night, but you set a TTL of two minutes. After all these time windows have collapsed under traffic pressures, it’s the actual hit ratio output that matters. This takes into account not just natural expirations, but also invalidations and adjust your target percentage accordingly. Having a high theoretical hit ratio is meaningless if write storms are purging out half of your cache every hour.
The second thing is picking the right engine. There’s no one-size-fits-all here. Plain key-value blobs is best stored in something like Memcached, which is faster and simpler. Tag-based invalidation is easier using Redis‘ rich set of data structures and pub/sub capability, which also help keep the churn down during heavy writes. In-process caches stop network delays by duplicating memory in each application instance. You’ll find a clear comparison table on the page comparing engines based off their capabilities so you can pick the engine that matches your access pattern instead of blindly picking the most popular choice.
For example, if you’re doing lots of lookups against a catalog with rare updates, then a simple LRU policy will do. High-write OLTP workloads requires an engine that lets you invalidate only the specific parts that change, such as rows. This prevents the entire cache from being cleared when just one row changes.
That’s not all. We also have people pulling levers that they don’t understand. For example, they know how to get 30% off of memory by compressing their large JSON payloads. But this is going to cost them CPU cycles on every get/put operation. It could very well be that the overhead of compression will exceed the storage savings at small entry sizes. This calculator allows you to take into account compression savings so that you can determine whether it’s worth the tradeoff for your specific result size. Small responses (under 10 kilobytes on average) may actualy be better served being stored unaltered and paying extra for RAM. Larger responses like complex GraphQL responses or massive analytics tiles need compression.
And finally: don’t forget to leave yourself some extra space. Since entries will fragment over time as they are allocated and freed up for entries of varying size. Leaving a 25% reserve means you won’t run out of memory when bursts invalidate existing entries, or when spikes in traffic result in new entries being added. It’s not about using all the bytes, it’s about having enough to keep the hot working set in memory without paying the penalty of constantly evicting entries from the cache.
Get this balance right and your database gets quieter and your application feels faster. Stop wondering why your cache looks full but runs poorly. It all comes back to the simple idea of measuring churn before committing to capacity.