Cable Attenuation Calculator
Estimate signal loss, receive level, link margin, maximum run length, and PoE voltage drop for copper Ethernet, coax, multimode fiber, single-mode fiber, and short data center cable plans.
⚙Named cabling presets
📏Cable run inputs
Calculation breakdown
📊Selected cable spec grid
The spec grid updates from the selected cable type, frequency, wavelength, route length, and connector plan. Manufacturer datasheets should be used for final certification.
📘Cable attenuation reference
| Cable type | Reference band | Typical attenuation | Normal limit | Best home lab use |
|---|---|---|---|---|
| Cat5e UTP | 100 MHz | 22.0 dB per 100 m | 100 m channel | 1G Ethernet drops, cameras, access points, low-cost patching |
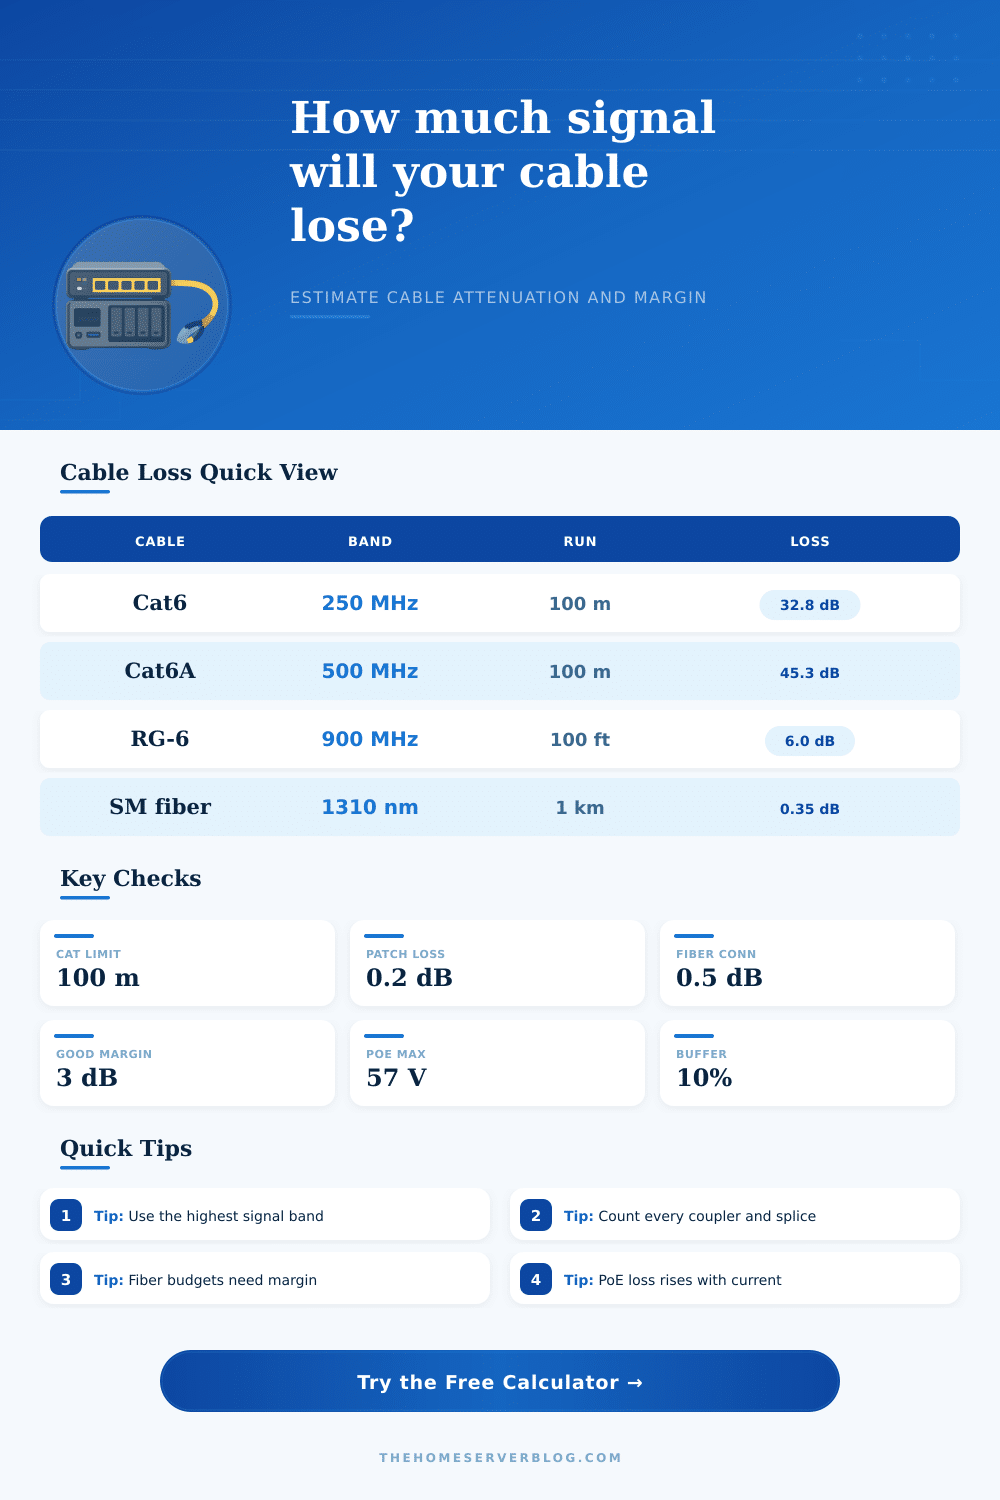
| Cat6 UTP | 250 MHz | 32.8 dB per 100 m | 100 m for 1G, shorter for 10G | General structured wiring and shorter 10G experiments |
| Cat6A UTP | 500 MHz | 45.3 dB per 100 m | 100 m 10G channel | 10GBASE-T between rack, office, and lab wall plates |
| RG-6 quad shield | 900 MHz | 6.0 dB per 100 ft | application dependent | Modem, TV, receive-only RF, and lab distribution legs |
| OM4 multimode fiber | 850 nm | 3.0 dB per km | 400 m at 10G SR class | SFP+ and short building backbones with LC patch panels |
| OS2 single-mode fiber | 1310 nm | 0.35 dB per km | optic budget dependent | Long outbuilding runs and clean future-ready trunks |
| Configuration | Typical route | Signal budget focus | PoE or power concern | Practical note |
|---|---|---|---|---|
| Patch panel to desk | 20 to 70 m | Insertion loss plus patch cords | Usually low unless PoE phone or dock | Count both patch leads because the channel is more than in-wall cable |
| PoE camera drop | 30 to 100 m | Cat cable insertion loss | Voltage drop can matter more than data loss | Higher-power cameras need clean copper and fewer couplers |
| 10GBASE-T uplink | 10 to 100 m | Cat6A channel headroom | No PoE on most uplinks | Cat6 may be fine for short links, but Cat6A is safer at full distance |
| SFP+ fiber backbone | 20 m to 2 km | Optical power budget | Powered by switch optics | Connector cleanliness often decides whether margin survives |
| Coax modem leg | 25 to 150 ft | Frequency-dependent coax loss | Not PoE | Splitters frequently dominate loss more than the cable itself |
| Standard or conversion | Planning value | Calculator use | Why it matters |
|---|---|---|---|
| Ethernet channel length | 100 m | Compares route to category cable limits | Includes permanent link plus both patch cords in most installations |
| PoE voltage window | about 44 to 57 V | Estimates far-end voltage after copper resistance | High-current devices lose more voltage over the same cable |
| Optical budget | Tx minus Rx | Subtracts fiber, connector, splice, and buffer loss | Fiber links fail when the receive power falls below optic sensitivity |
| dB power ratio | 3 dB is half | Converts loss into percent signal retained | Small dB changes are large power changes on long cable runs |
| Metric conversion | 1 m = 3.28084 ft | Normalizes copper, coax, and fiber lengths | Datasheets may publish loss per 100 m, 100 ft, or km |
| Project size | Likely cable | Reference length | Expected result | Secondary check |
|---|---|---|---|---|
| Small office switch to desk | Cat6 | 45 m | Comfortable 1G margin | PoE phones are usually fine |
| Outdoor PoE camera | Cat6 or Cat6A | 80 m | Data should pass if terminated well | Check voltage drop and couplers |
| Rack to detached garage | OS2 fiber | 150 m | Very low fiber loss | Use surge isolation by choosing fiber |
| Basement to attic modem split | RG-6 | 90 ft | Loss depends on carrier band | Splitters and old fittings matter |
| Two-rack SFP+ patch | Passive DAC | 3 m | Tiny cable loss | Stay inside DAC length rating |
💡Cable planning tips
Every run of cable involves a budget of signal strength that you must protect. The signal begins at a transmitter with a specific strength. However, the signal that arrives at the end of the cable has less signal strength than the starting signal strength.
The difference between the starting signal strength and the ending signal strength are known as attenuation. Attenuation is a measurement of the loss of signal strength. Attenuation vary according to the type of cable that is used, the length of the cable, the frequency of the signal, and the number of connectors that is joined to the cable run.
How to Calculate Cable Signal Loss
Each of these variables can be entered into the calculator so that you can determine the total attenuation for the cable run. Each of the fields that are provided require that you enter specific information. For example, you must enter the length of the cable that will be used.
However, the length of the cable only matters if you also enter the reference distance for that type of cable. You must enter the frequency at which the signal will travel through the cable. Copper and coaxial cables lose signal strength at different rates at different frequencies.
For example, a cable may have enough margin for signal loss at 100 MHz to power a link between two building, but the same cable may lose all of its signal strength at 500 MHz. This is why 10-gigabit links require more high-grade cable than links at 1 gigabit per second. Fiber optic cables lose signal strength differently than copper and coaxial cables.
For fiber optic links, the loss is measured in kilometers and based off the wavelength of the light signal. Any incorrect wavelength will not allow the signal from the transmitter to reach the receiver. Each connector between the optical fibers along the link will also cause some loss of signal strength.
Each connector that is dirty or inserted incorrectly will reduce the signal strength of the link, so every connector that will be used in the link should be counted in the entry field for the number of connectors. The calculator will provide three specific results for the planned link. The first result will be the total attenuation for the link, which is the total loss of signal strength along the link as the calculator calculates it.
The second result will be the receive level, which is the signal strength that will be received at the end of the link. The third and last result is the link margin, which is the difference between the receive level and the minimum level of signal strength that is required to allow the receiver to properly function. A positive link margin will indicate that the link will work.
Three decibels or more of link margin is considered helpful to provide some extra signal strength in case of other variables that may reduce the signal strength along the link, such as aging of the cables, changes in temperature, or the addition of patch cords. A link margin that is three decibels or less indicates that the link margin is too low for the link to be effective. Power over Ethernet link calculations are included within this tool because Signal strength and voltage drop along the same cable.
For example, more power is required to operate larger device. Higher resistance in the cable turns the power to heat. As the length of the cable increases, the voltage decreases along that cable before it reaches the device.
The voltage at the load can be calculated so that you can determine whether the cable will supply enough power to the device. If the voltage is too low, then cables of a higher gauge can be used or a power injector placed near the device. Published specifications for links may not account for the way in which cables may behave in real installations.
For example, there may be a loop in which the signal must travel, there may be bends in the cable that are tighter than the cable specifications allow, and there may be temperature extremes to which the cables are exposed. Each of these factors will increase the signal loss along the link. A derate field allows you to enter the percentage at which the signal strength will drop due to these factors.
For indoor installations, a 10 percent derate is often enough allowance for signal loss. Outdoor installations or installations that travel through crowded areas may require a 15 percent or 25 percent derate. Cables that are installed outdoors or in crowded areas experience more stress upon themselves and the connectors along those cables can be harder to keep clean.
The reference tables that are published for each type of cable indicate the signal loss for that type of cable under ideal conditions. The link calculations for each of the planned links can be compared to the published rates for signal loss for the type of cable that is to be used. The rates that are published in these tables are provided per 100 meters of copper cable or per kilometer of fiber optic cable.
If the calculated signal loss is much worse than the signal loss rates published in the tables, then it is likely that one or more of the inputs in the calculation are incorrect. The distance that is entered may be less than the actual route of the cable. The frequency may be higher than the frequency at which the cable is rated.
The number of connectors may be higher than the number that is typically used along a link. Many problems with links can be avoided by treating link attenuation as a running total of losses instead of as a fixed value. For instance, it is easy for people to calculate the attenuation for the main link between two buildings, but to forget to account for the patch cords that enter into those buildings.
People may count the main connectors for a link, but fail to account for couplers or split connectors that may be placed along the run of the link. A person may calculate that a certain grade of cable can handle the distance between two locations, but that calculation did not account for the fact that the maximum frequency for that calculation was used and that each installation of the link may experience additional attenuation. These problems can be avoided by using the calculator to include every potential loss for the link before the link is pulled.
It is a habit that should of been developed to run the link calculation twice. You can calculate the link using the actual length of the link and the actual number of connectors that will be used along the link. The second calculation of the link can be run that includes the introduction of 10 or 15 percent to the length of the link to account for the way in which the route of the link may change.
If both calculations result in a positive link margin of three decibels or more, then the link is likely to be successful. If the link margin becomes too low after introducing 10 or 15 percent into the length of the link calculation, then there are other options that can be used instead of the one that was initially planned. Attenuation will gradually reduce the signal strength along a link with every meter of cable and every connection of devices to that cable.
Attenuation will continue to reduce the signal strength until the receiver no longer decodes the signal. A link may successfully transmit data to the receiver on the day that it is first established, but due to a change in the temperature of the link, the receiving device may no longer decode the signal. It is important to calculate the link before the installation of the link itself.