Cache Hit Ratio Calculator
Estimate cache hit ratio from hits, misses, request rate, object size, cache capacity, TTL, eviction rate, origin offload, and latency saved.
Calculation breakdown
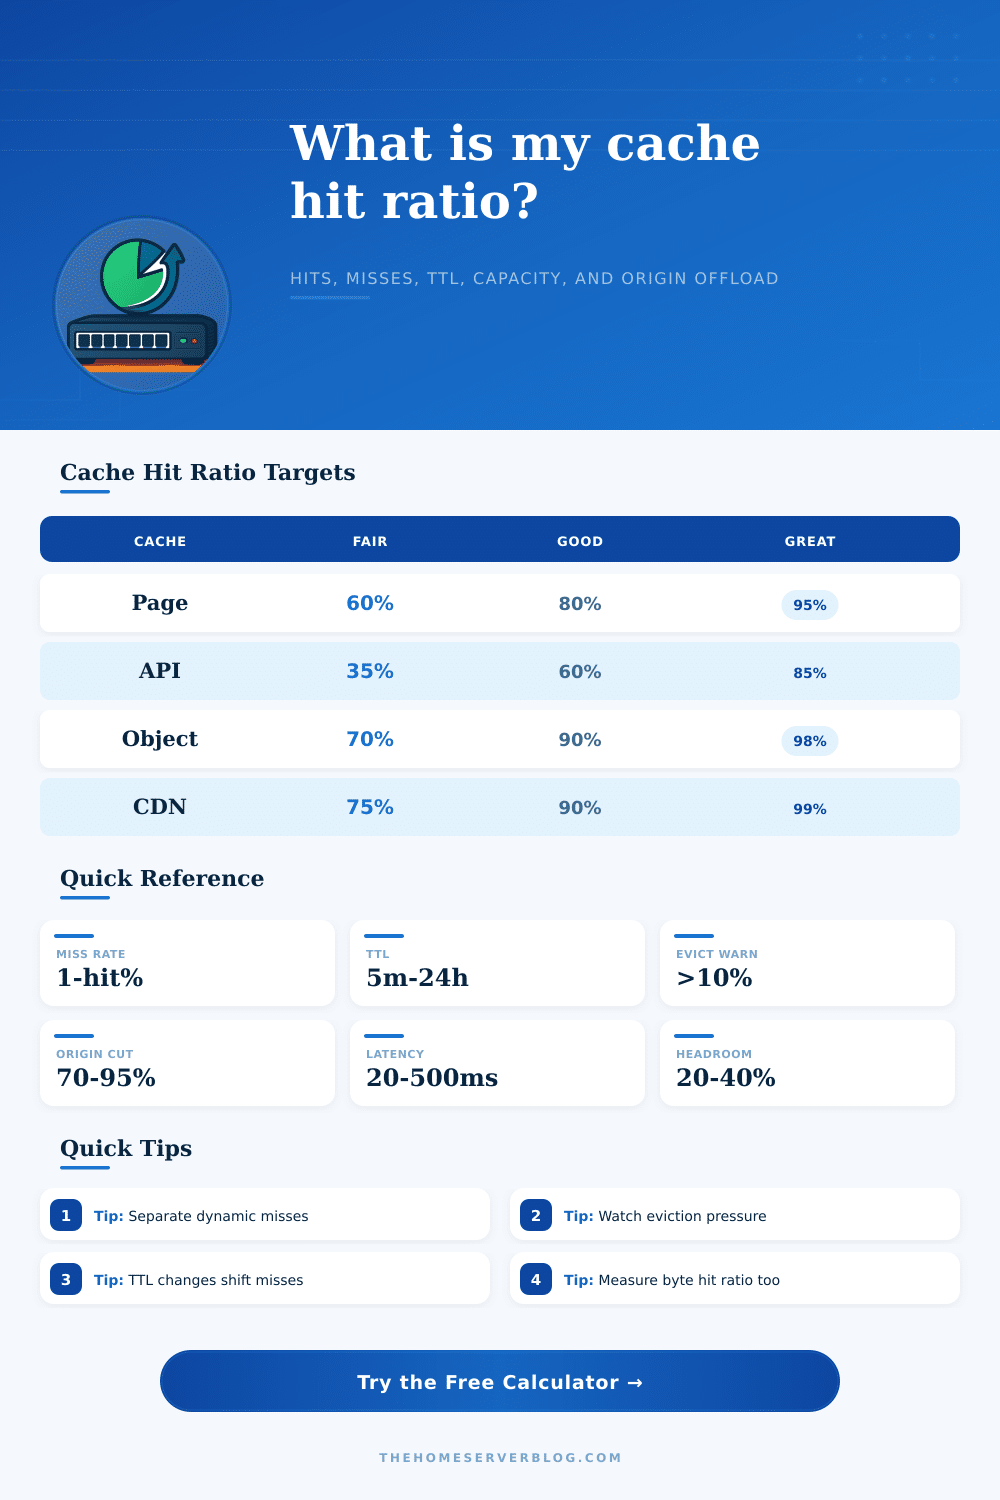
| Cache layer | Common hit range | What improves it | What lowers it | Planning target |
|---|---|---|---|---|
| Static asset CDN | 85% to 99% | Long TTL, hashed filenames, edge reuse | Frequent purge, query strings, private headers | 90%+ |
| WordPress page cache | 60% to 95% | Anonymous traffic, full-page cache, warm URLs | Logged-in sessions, cookies, comment bursts | 80%+ |
| API response cache | 30% to 85% | Stable parameters, shared keys, short TTL | Per-user data, high cardinality, cache-busting | 60%+ |
| Redis object cache | 70% to 98% | Right maxmemory, key reuse, LFU policy | Small memory cap, churn, huge keyspace | 90%+ |
| NAS metadata cache | 50% to 95% | Repeated directory walks, enough RAM | Cold scans, large media libraries, index churn | 75%+ |
| Metric | Formula | Use | Warning sign | Safer practice |
|---|---|---|---|---|
| Request hit ratio | Hits / (hits + misses) | Shows request-level offload | High hits but large misses still hurt | Track byte hit ratio too |
| Origin request rate | Request rate x miss rate | Sizes origin app and database load | Peak origin rate exceeds app capacity | Use a busy-hour multiplier |
| Objects that fit | Capacity / object size | Compares cache space to object count | Working set larger than capacity | Keep 20% to 40% headroom |
| Eviction pressure | Evictions / loaded objects | Finds churn from small caches | Pressure above 10% to 20% | Raise capacity or improve key reuse |
| Latency saved | Hits x (origin ms - cache ms) | Turns hit ratio into user impact | Cache latency close to origin latency | Measure p50 and p95 separately |
| Scenario | Typical object | TTL pattern | Capacity driver | Best first change |
|---|---|---|---|---|
| Static blog edge | CSS, JS, images | Hours to months | Asset versions and image sizes | Use hashed filenames and long TTL |
| WordPress page cache | Rendered HTML | Minutes to hours | Popular URLs and purge frequency | Bypass only truly dynamic pages |
| API response cache | JSON payloads | Seconds to minutes | Parameter cardinality | Normalize cache keys |
| Package repo mirror | Tarballs and indexes | Hours to days | Large file reuse | Keep indexes fresh, packages long-lived |
| DNS resolver cache | DNS answers | Authoritative TTL | Repeated clients and domains | Respect TTL and avoid negative-cache bloat |
| Symptom | Likely cause | Metric to check | Change to test | Expected result |
|---|---|---|---|---|
| High miss rate with low evictions | TTL too short or uncacheable responses | TTL expirations and cache-control headers | Increase TTL for stable routes | More repeated requests hit cache |
| High evictions and falling hit ratio | Cache too small for hot working set | Evictions per minute and memory fill | Raise capacity or reduce object size | Lower churn and better warm cache |
| Good request hits but poor byte hits | Large objects miss more often | Byte hit ratio by content type | Pin or prewarm large popular assets | Origin bandwidth drops faster |
| Cache latency is not much faster | Remote cache, slow disk, or serialization | p50 and p95 cache response times | Move hot cache closer or use memory tier | More latency saved per hit |
| Hit ratio resets after deploy | Broad purge or version churn | Purge count and warmup duration | Purge by tag or URL group | Less origin surge after changes |
When your home server is stuttering, it’s not often due to a hardware issue. It’s usually due to missing enough cache that it’s hammering something behind the scenes (either the disk), or the database. Your system’s hit ratio are the single most important performance metric. Did data stay local? Did it respond instantly? That’s a high ratio. Every request had to be a slow trip back to origin? That’s a low ratio, and it adds up quick.
After you have entered your number of hits and misses, the calculator above will do math for you. But it gets realy interesting when you understand what these numbers mean. Most folks looks at this number: percent of requests served from cache. This is called the request hit ratio, which seems easy to look at. But it can be incredibly deceptive if you don’t also take into account object size.
Why Cache Performance Matters
You may serve thousands of tiny config files out of cache and look really good on paper. Missing one two-gigabyte video file mean missing a ton of bandwidth and latency, even though you only registered one miss in the request count. That’s why byte hit ratio is important in the real world, and why you can check (or even override) it independently with the tool: Big things aren’t like little things. Your request percentage might look good even while your origin server struggle with high bandwidth costs because your cache misses on large objects but works well for small text responses. Is the cache saving compute or merely shuffling the deck? That’s what you should of care about. It tells you if you’re optimizing effectively… Or simply papering over a design flaw that affects keys.
There’s yet another wrinkle here: capacity planning. Raw percentages don’t show you that part of the picture. No, your cache doesn’t hold everything indefinitely. Of course it doesn’t. It only holds things hot enough to be worth keeping on a fast medium (or in RAM). The page has a reference table for these points. It shows that wildly different performance expectation exist across layers, from local Redis instances to CDNs. Why? Because a static CDN aim for nearly perfect retention: there isn’t much asset churn. An API cache handling user-specific data, on the other hand, will obvious churn more keys. And in that context, freshness trumps speed (so acceptable ratios will be lower).
That churn is driven straight off TTL settings. If it is too low, you will needlessly cause cache hits to become misses. This forces expired-but-still-valid items to exit before they get used again. This looks like a capacity issue, but it is actualy a configuration issue. If it is too high, you are serving up stale content. This is bad for user experience or application logic. The only way to find the right balance is to monitor eviction rate carefully.
If items are being kicked out to make room for newcomers before they have been used again, your working set are simply larger than the size you budgeted. Tweaking those headers isn’t going to help you if you’ve got a box too small for the job. This difference becomes apparent under eviction pressure. If your eviction count goes up and yet your hit ratio go down, it’s time to think about reducing the size of the object being cached, or else just adding more memory. Adding more RAM may not be as good a solution as compressing the payload before storing it in the cache, it effectively increases the “density” of the cached object. You want most of the frequently used set of data to be resident and allow the colder stuff to evict itself naturaly.
For the end user, however, it’s maybe the most noticeable outcome: each millisecond saved in latency builds up over thousands of request per second. A drop in origin latency from two-hundred milliseconds to single digits may seem dramatic when viewed in dashboard terms, but it translates into perceived responsiveness on-screen. It keeps servers cool, makes browsers happy. So in the end, it’s about making trade-offs between speed, capacity, and freshness. You can’t get them all at the same time without a bunch of engineering effort. Knowing how far off you are give you the right idea of what lever to pull next. Make sure that the things you request most often always hit, then optimize for object size, and finally fine-tune your expiration policy. Follow the numbers, not your gut, and you’ll be able to deliver reliably.