Memory Allocation Calculator
Plan server RAM across heap size, stack reserve, process count, page size, allocator overhead, fragmentation, pool or slab objects, and usable memory headroom.
Allocation Breakdown
| Scenario | Main allocation | Typical pressure point | Planning reserve | Useful input focus |
|---|---|---|---|---|
| VM host | Guest RAM plus host cache | Ballooning and file cache loss | 20% to 30% | Process count as VM count, heap as guest RAM |
| Container host | Worker RSS and shared libraries | Many small heaps and page cache churn | 15% to 25% | Process count, stacks, allocator overhead |
| Java service | Heap, metaspace, native memory | GC reserve and direct buffers | 20% to 35% | Heap target, shared mmap, fragmentation |
| Database | Shared buffers and per-session memory | Connection count and sort/hash work memory | 20% to 30% | Shared memory, process count, pools |
| Cache server | Object cache plus allocator waste | Fragmentation from churned keys | 15% to 25% | Pool object size, object count, frag percent |
| Page size | Where it appears | Benefit | Tradeoff | Calculator effect |
|---|---|---|---|---|
| 4 KB | Typical x86 Linux base pages | Fine-grained memory use | More page table entries | Low rounding waste for tiny objects |
| 16 KB | Some ARM and database builds | Lower page management overhead | More slack for small allocations | Higher page slack estimate |
| 64 KB | Large base page systems | Fewer mappings | Can waste space for small heaps | Useful for large sequential buffers |
| 2 MB | Transparent or explicit huge pages | Fewer TLB misses | Coarser allocation granularity | Good for large heaps and databases |
| 1 GB | Huge page backed VMs or databases | Very low TLB pressure | Requires careful reservation | Only sensible for very large regions |
| Allocator pattern | Common overhead | Fragmentation behavior | Good fit | Planning note |
|---|---|---|---|---|
| glibc malloc | 6% to 15% | Arenas can retain memory | General Linux services | Watch many-thread workloads |
| jemalloc | 5% to 12% | Size classes reduce churn waste | Databases, caches, web services | Stats are useful for tuning |
| tcmalloc | 6% to 14% | Thread caches trade RAM for speed | High-concurrency services | Thread cache can inflate RSS |
| Slab or pool | 2% to 8% | Predictable for fixed objects | Kernel objects, caches, packet buffers | Object size choice matters |
| GC managed heap | 10% to 30% | Needs live-set and collection room | JVM, Go, .NET, Node.js | Do not set heap equal to RAM |
| Pool type | Object size | Example count | Raw pool size | Why reserve it |
|---|---|---|---|---|
| Packet buffers | 2 KB | 262,144 | 512 MiB | NIC bursts and routing queues |
| HTTP request objects | 32 KB | 20,000 | 625 MiB | Web workers and connection bursts |
| Cache entries | 64 KB | 100,000 | 6.1 GiB | Application object cache caps |
| Database work memory | 4 MB | 512 | 2 GiB | Sorts, hashes, temp operators |
| VM page cache chunks | 2 MB | 4096 | 8 GiB | Large mapped working sets |
| Planning layer | Formula component | What to measure | Common mistake | Safer practice |
|---|---|---|---|---|
| Heap | Process count × heap target | RSS, committed heap, cache cap | Ignoring native memory | Reserve extra for runtime and mmap |
| Stack | Processes × threads × stack reserve | Thread count and stack limit | Counting only active stack pages | Budget reserve for spikes |
| Pages | Regions rounded to page size | Base page or huge page setting | Huge pages for tiny objects | Use huge pages for large stable regions |
| Allocator | Metadata plus fragmentation | Allocator stats and RSS drift | Assuming overhead is always zero | Track overhead as a percentage |
| Headroom | Usable RAM minus demand | Swap use, OOM events, cache pressure | Running at 95% memory every day | Keep 15% to 30% free for bursts |
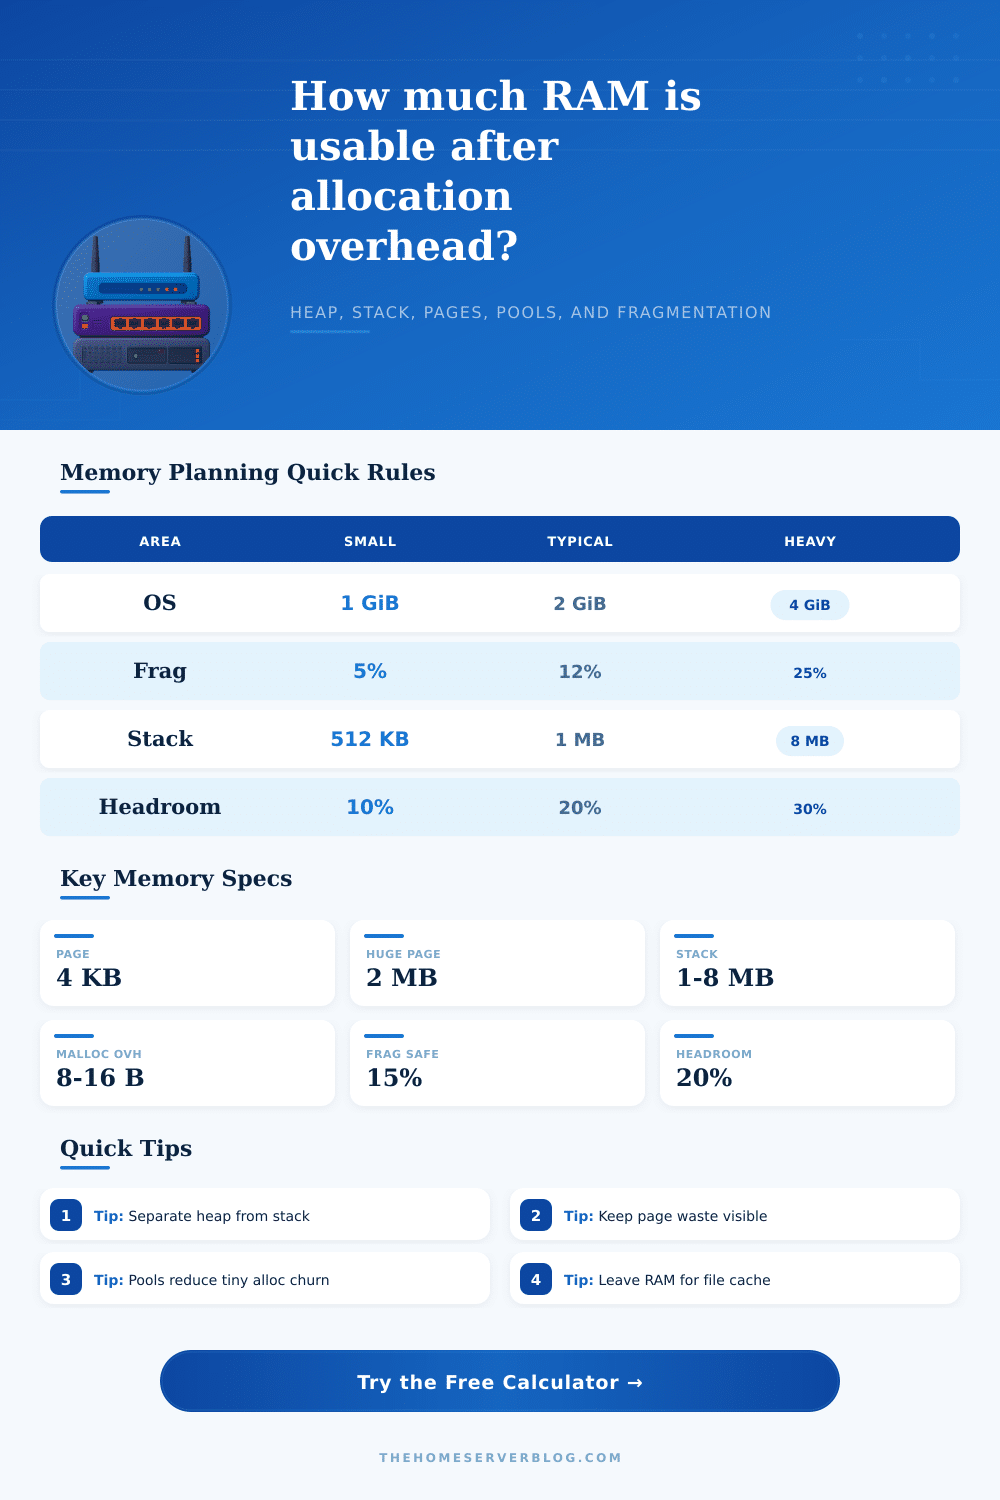
I have all this free memory on my machine, but it somehow still manages to start swapping! Why? This isn’t typically a hardware issue. It’s an accounting issue. You buy actual chips. You spend virtual currency without tracking exchange rate. The above calculator does that math for you. It removes the marketing optimism and reveals what your application actualy eats.
Heap size is what most developers think about: if you’re running Java or Node.js, you’ve got your maximum heap size target, and everything else will work out, right? Wrong. Heap is only part of a longer receipt. Threads is spawned for each process, and even those threads reserve stack space regardless of whether they need it or not. By default, Linux allocates several megabytes of space per thread. Sounds reasonable, right? Until you realize that’s multiplied by sixteen threads times eight worker processes. Suddenlly you’re reserving hundreds of megabytes of empty air.
Why Your Computer Uses More Memory Than You Think
Next is allocator overhead. Memory managers aren’t free. They need to track who owns the metadata. Requirements vary by memory manager (glibc malloc, jemalloc, tcmalloc). Some maintain thread-local caches for faster allocation. This further inflates your resident set size, even while your app is idle. The page reference table lays it out clearly. It shows that general-purpose allocators can waste over ten percent of memory just on bookkeeping. When you’re dealing with millions of tiny objects, those percentages adds up to gigabytes of lost potential.
This is where fragmentation kills quietly. You may have some free memory but it’s fragmented into little holes that are too small to satisfy your next request. This is modeled by the calculator which lets you plug in an external fragmentation percentage. It makes you realize that not all your free RAM is usable RAM. That twenty percent headroom reserve is more than just a safety buffer. It is price you pay to have a stable system under load.
People don’t realize how important the page size is. For most workloads, four kilobyte pages will do just fine. For some applications, huge pages can eliminates the overhead and TLB misses. These include a cache server or a database with large continuous buffers. But they also bring in waste due to granularity. You can’t use half of a two-megabyte page. The tool takes that into account and automatically changes the waste due to rounding depending on what page size you select.
Planning typically ignores shared memory reserves. PostgreSQL is a big user of shared buffers. And if you don’t budget for that mapped memory, then your app will attempt to grab RAM that the kernel has reserved for caching data. This result in unpredictable latency spikes and contention. Isolating these fixed costs and keeping them separate from variable heap growth allow you to size your pools and understand the inputs for shared memory.
That’s how this capacity-planning-by-arithmetic works. It turns vague guesses about server capacity (“Will my microservice cluster fit on that sixty-four-gigabyte server?”) into exact numbers (“The sum of all the memory needed by our processes’ heaps, plus their threads’ stacks, plus allocator metadata, plus shared reserves, is X gigabytes, minus OS reserve Y gives Z gigs, so we need some extra safety margin.”) And then it tells you if you’re running out of headroom (i.e., if Z is negative), and what you should of do about it, dial down thread counts? You could change allocators. You could add some more RAM.
It’s never really about memory planning as much as it’s about understanding the cost of memory usage. Not monetary cost. Memory cost. Because memory isn’t free; it takes other resources away and those costs are hidden on top. The calculator doesn’t predict the future. It doesn’t protect against the rare but catastrophic failure. But it protects you from the most common failures here, today. It helps you understand the waste and the overhead that tools like top fail to show you. And that lets you design systems that work, instead of reactively fixing them when they OOM-kill.
That’s a tiny change in mindset. It makes all the difference in how your systems handles load. Make the math easy. Make the reserve genuine. Allow the machine to do its job: get out of trouble.