Kubernetes Pod Resource Calculator
Estimate pod-level CPU, memory, ephemeral storage, init peaks, pod overhead, namespace totals, and node packing from Kubernetes requests and limits.
| Resource | Regular containers | Init container rule | Overhead rule |
|---|---|---|---|
| CPU request | Sum app containers and sidecars | Compare with largest init request | Add pod overhead CPU |
| Memory request | Sum app containers and sidecars | Compare with largest init request | Add pod overhead memory |
| CPU limit | Sum app container and sidecar limits | Not used for scheduler packing | Track for quota pressure |
| Ephemeral storage | Sum container requests and limits | Init storage can spike during setup | Node disk pressure can evict pods |
| Runtime style | Typical CPU overhead | Typical memory overhead | When to use |
|---|---|---|---|
| Standard container runtime | 0-10m | 0-16Mi | Most default nodes |
| RuntimeClass sandbox | 10-50m | 16-128Mi | gVisor, Kata, sandboxed pods |
| Service mesh injected pod | Sidecar-based | Sidecar-based | Count proxy as a sidecar |
| High-security workload | 25-100m | 64-256Mi | Sandbox plus policy agents |
| Workload | Starting request | Limit pattern | Packing caution |
|---|---|---|---|
| Tiny HTTP API | 100-250m, 128-512Mi | 2x CPU, 2x memory | Watch cold starts and probes |
| Java service | 500m-1 CPU, 1-2Gi | Heap-aware memory limit | Leave non-heap room |
| Queue worker | 250m-1 CPU, 512Mi-2Gi | CPU burst can be useful | Scale by queue lag |
| Stateful database | 1-4 CPU, 2-16Gi | Memory limits need care | Avoid tight overcommit |
| ML inference | 1-4 CPU, 4-16Gi | Model size drives memory | Include warm model cache |
| Observability agent | 50-250m, 128-512Mi | Limit logs and buffers | DaemonSet uses every node |
| Item | What it affects | Common starting point | Operational note |
|---|---|---|---|
| emptyDir cache | Node ephemeral disk | 0.5-5Gi per pod | Set sizeLimit for memory-backed caches |
| Container logs | Node filesystem pressure | 100Mi-1Gi per pod | Rotate logs and cap verbosity |
| Image layers | Node image filesystem | Shared across pods | Large images slow churn |
| Scheduling headroom | Effective node capacity | 10-20% | Protects upgrades and reschedules |
Small mistakes in Kubernetes sizing are the root cause of infrastructure disasters. Maybe you asked for too much memory when standing up your new service, or maybe the batch jobs was underestimated in terms of their CPU requirements. Day one your cluster seems fine. Then week three rolls around and nodes start getting full without notice. Performance starts to degrade. More often than not a Kubernetes environment doesn’t break from one misconfiguration it’s typically dozens of little miscalculations across dozens of pod. The size of your resources matter because all those little mistakes add up.
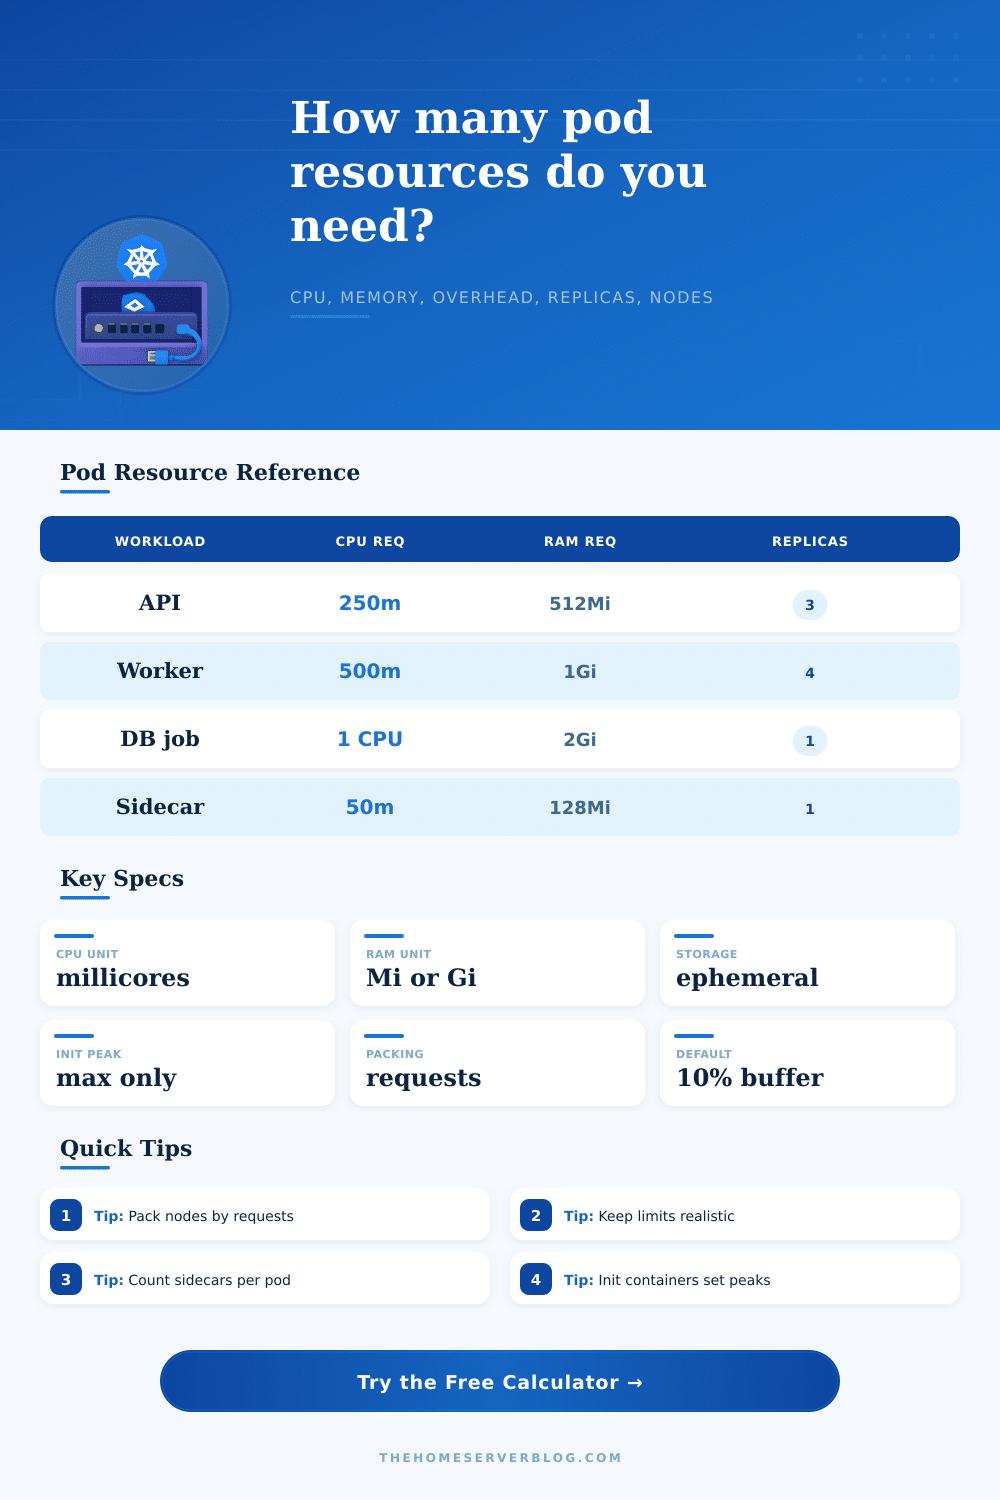
Define your container profiles on this page and let the calculator take care of the math for you. You won’t have to guess how init containers and sidecars affects pod density.
How to Fix Kubernetes Resource Mistakes
Kubernetes resource management comes down to this: Scheduling + Runtime. When you deploy a pod, you specify a request (where should the pod live?) and limit (how many resources can the pod consumes during its lifetime?). Too low of a request results in pods constantly jumping across the cluster, leading to unwanted context switching and increased latency. Too small of a limit mean your processes get killed because they attempt to consume more than you’ve allocated them. The trick here is understanding that both fields exist for a specific purpose. Limits define how much physical space a given pod may occupy at a certain node; requests guarantee a pod has somewhere to call home.
This gets complicated by sidecars. Sidecars are extra container that sit next to your application but don’t perform the main task. This includes log forwarders and service mesh proxies. When many engineers estimate how many resources pods will require, they only consider the main app container and find it requires modest amount of memory and CPU. Since they don’t account for the extra resources sidecars use, they think the entire pod is lightweight. Then they deploy thirty replicas instead of just three. Those little sidecar costs adds up to a lot of resource drain. This tool brings those otherwise hidden costs back into a pod footprint so you can get an accurate idea off the cost of running your architecture.
There’s one additional problem with init containers: The maximum amount of resources a pod can use is based on what your app containers ask for plus highest single request from any of its init containers. So if you have a large init container (like a database migration script), it might schedule based off that request alone, regardless of whether or not this init container is still alive. This is the part when folks trip up. They think they’ll get their resources back as soon as their init container terminates; however, by then the scheduler has already committed to keeping that much resource allocated to that node until the pod itself go away.
And then there’s node packing, where theory meets financial reality. A finite number of hardware nodes can only accommodate so many pods. The interface’s reference table displays the overhead of various runtime styles, ranging from sandboxed environments like gVisor to standard containers. Sandboxed runtimes do improve isolation while requiring a greater resource cost per pod. That’s a price worth paying if your workloads require security isolation. For instance, stateless microservices. But if your workloads involve high-density batch jobs, every millicore matter. For each workload style, it’s up to you whether safety or density is the priority.
The difference between production grade clusters and those used by novices comes down to scheduling headroom. It may look wasteful on your spreadsheet to have 10% capacity left idle. On the live system, though, this give you room for sudden traffic spikes, upgrade time, last minute reschedules, etc., without bringing down neighboring workloads. Packed-to-the-gills at 100% use isn’t efficient; it’s fragile. Your balance of cost-savings vs operational resilience can be seen in the math. You should of looked at these numbers carefully.
In the end, that’s what resource management is all about: predictability. Knowing precisely how much every component costs allows you to scale confidently, not fearfully. You begin to treat your cluster as a machine that you understand rather than a black box. Good sizing eliminates the silent failure which will result in problems down the road. It replaces uncertainty with known capacity and makes everything more comfortabley.