Cloud vs On-Prem Cost Calculator
Compare cloud instances against a home server or rack plan using node count, utilization, storage, egress, power, term length, and operating buffer.
Cloud vs On-Prem Result
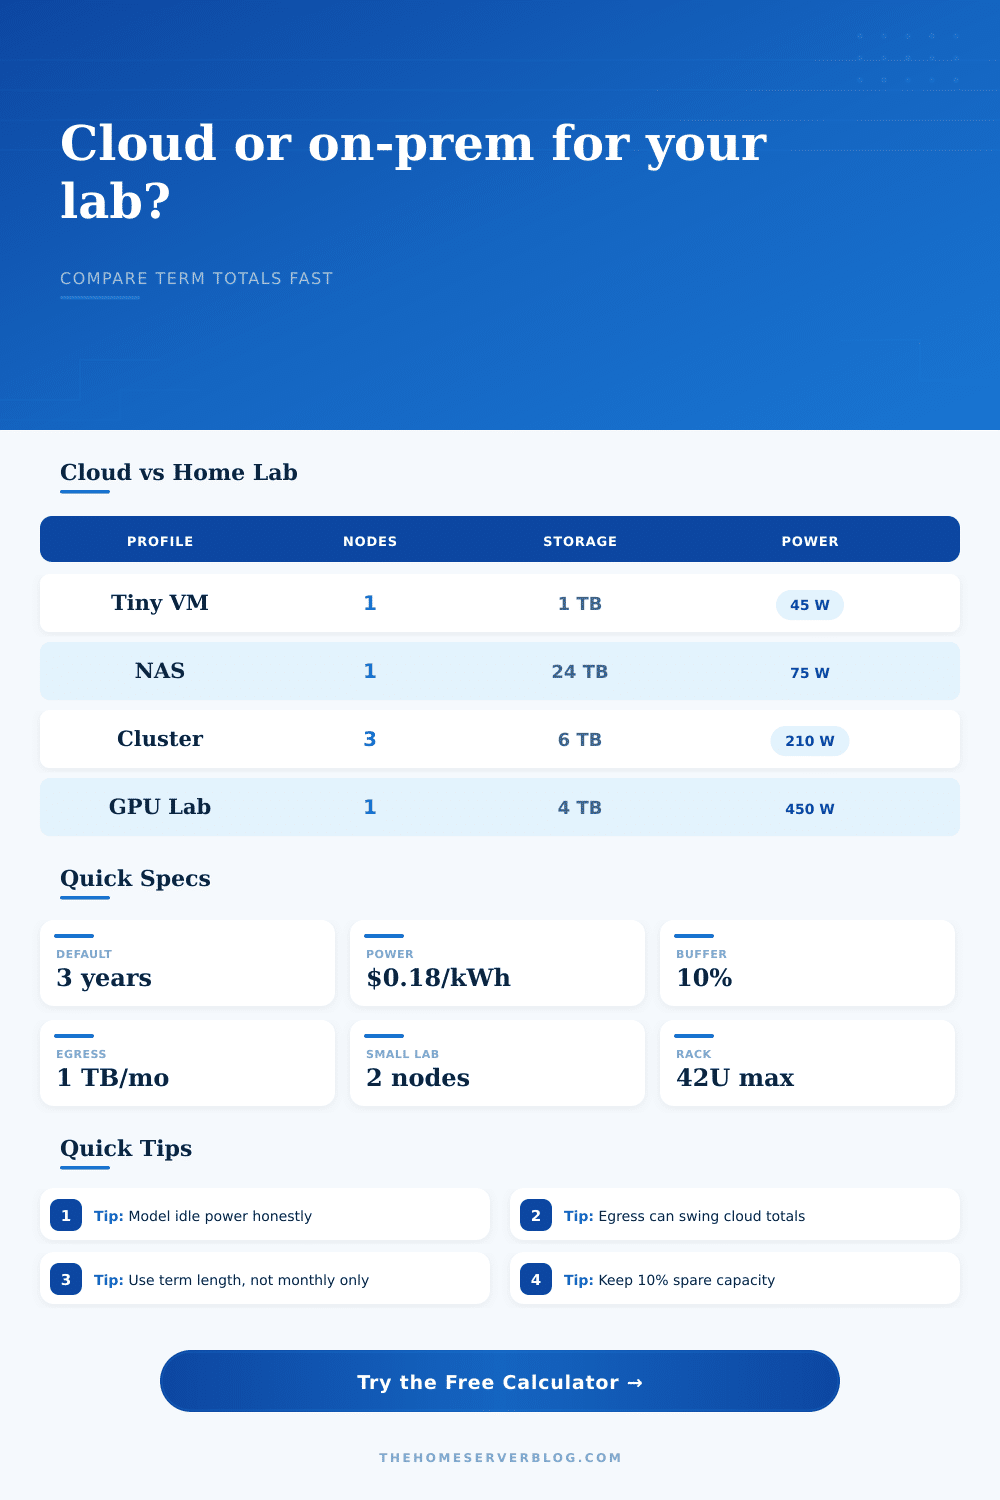
| Profile | Cloud Match | Home Lab Baseline | Best Fit |
|---|---|---|---|
| Mini PC virtualization | General purpose VM | Low-power 8-core host | Docker, DNS, small VMs |
| NAS and file services | Object plus block storage | 6-bay mirrored or RAIDZ array | Backups, shares, photos |
| Proxmox cluster node | Reserved compute instances | Three 1U nodes with shared storage | HA labs, staging clusters |
| GPU compute workstation | GPU instance family | Single workstation GPU server | AI tests, render jobs |
| Cost Driver | Cloud Behavior | On-Prem Behavior | Calculator Treatment |
|---|---|---|---|
| Compute | Scales with instance count and utilization | Mostly fixed after hardware purchase | Utilization factor on cloud compute |
| Storage | Monthly per provisioned TB | Upfront drives plus replacements | Term storage vs capital storage |
| Egress | Usually metered after allowance | Usually bundled into ISP plan | Cloud egress line item |
| Power | Bundled into service | Watts, cooling, and duty cycle | kWh plus 35% cooling load |
| Standard or Rule | Common Value | Practical Limit | Why It Matters |
|---|---|---|---|
| Rack unit | 1U = 1.75 in | 42U full rack | Turns nodes into rack space |
| Continuous load | 80% circuit planning | 12 A on 15 A circuit | Keeps always-on gear sensible |
| Heat conversion | 1 W = 3.412 BTU/hr | Room airflow varies | Power becomes cooling load |
| 10 GbE copper | Cat6A to 100 m | Cat6 shorter at 10G | Network upgrades affect lab scope |
| Project Size | Typical Gear | Primary Result | Secondary Check |
|---|---|---|---|
| Home office services | 1 mini node, 1 TB storage | Low recurring on-prem load | Cloud wins for bursty apps |
| Family backup NAS | 1 NAS, 16 to 40 TB usable | Storage often favors on-prem | Remote copy still needed |
| Three-node lab | 3 compute nodes, 6 TB usable | Hardware term matters | Power and spares add up |
| GPU experiments | 1 GPU server, 4 TB storage | Winner depends on duty cycle | Idle watts are decisive |
People start out wanting their systems available all the time and then they wind up maintaining complicated spreadsheets. The cloud versus on-premise debate is rarely about raw computing power: hardware vs cloud services. It’s always money; it’s always capex vs opex. It is about whether you want to be an electrician or a manager, too. Do you want someone else doing physical maintenance? Or do you want to do heavy lifting yourself? With the calculator you’re not typing in figures. You’re stating how comfortabley you are with hardware upkeep compared to how much you like paying by the month. The tool models the math for you but the decision require understanding what drives those costs in the real world.
But you need to know what things cost in real world. People often compare hardware costs as if they were one time versus month-to-month cloud costs. Hardware fails, servers grows old. You pay for electricity whether you own hardware or not. When using the calculator, consider a three or five year view. Why? Because upfront cost of something like a NAS system or a Proxmox cluster can seem cheap. Then you realize that there’s always going to be power and cooling bill. Even when that server isn’t in use it still draws power. For example, a GPU workstation may suck down only 450 watts but that doesn’t mean it isn’t drawing any power while it’s idle. The calculator assumes a cooling load on top of whatever electricity you put into a device. That’s what life is like: your server room is not a vacuum.
True Costs of Cloud vs On-Premise
How does this work with storage? Storage gets counter-intuitive. With cloud, you pay monthly based off terabytes stored. In home storage, you buy it once and forget about it (unless it fails). If you have lots of backup files, cloud may get pricey. If your data changes all the time, cloud’s flexibility will save you money. The chart on the page describes how storage work in each environment. It also notes that storage at home is an asset; in the cloud, it’s a service. Thinking of an asset as a service will cause you to lose money. To fairly compare, you need to spread the cost of the drive across its useful life.
Egress fees are a big hidden cost. Most home internet plans bundle your upload bandwidth. Most cloud providers charges more for outbound data. For workloads that send data back to users, this can drastically affect your overall cost. You can configure the calculator for outbound and monthly costs. That will help you understand which situations would cause the cloud to be expensive different than convenient.
Data flows in both directions. Providers typically charge less for inbound. They make money from outbound. Costs depend on usage rates: You’re only using part of your server (e.g., running at 35% capacity) so you’re paying for unused resources. That’s why in the cloud, you generally pay for what you use. Reserved instances alters that equation. The calculator changes cloud compute pricing with baseline capacity and scheduler savings. That’s how real businesses work; and how serious homelabs operate. They don’t burst resources by the hour. They run steady services. It models idle power honest to show a realistic break-even point.
Never discount that overhead buffer. Licenses change, hardware breaks. You need spare capacity for future growth. Add a 10% or 20% buffer to your model to account for variance. Be prepared for those replacement part costs rather than being surprised by them. This isn’t about finding the absolute cheapest option. It’s about finding the most predictable option. If you forget to turn off a test instance, cloud costs will spike. On-premise has steady costs but requires hands-on maintenance. You should of considered that. Do you hate managing hardware? Go cloud and get that peace of mind via subscription. Do you love to tinker and have a reliable power grid? Get a home lab and save money in the long run.
Use the calculator as a way to cut through the moddern marketing hype and get down to the nitty gritty. What are you shelling out for? A cloud instance? Or a rack? Either way you want to know exactly what you’re getting. And the numbers speak for themselves. Budgets do matter.