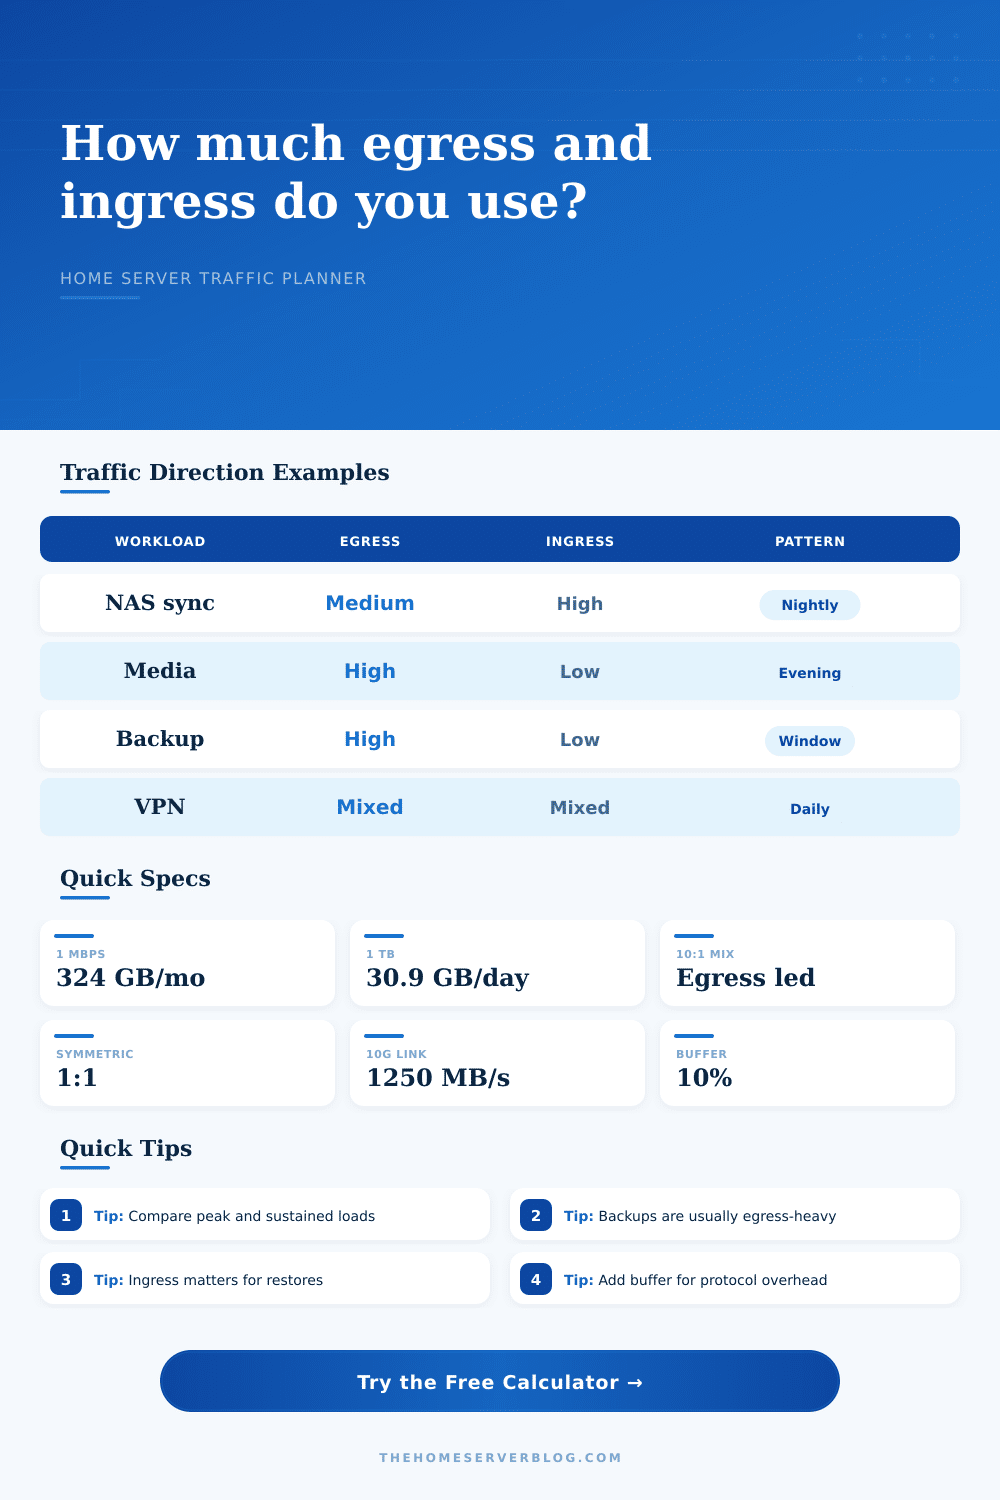
Egress vs Ingress Calculator
Estimate outbound and inbound transfer, direction balance, 95th percentile load, and gateway headroom for home server traffic.
📌Network Traffic Presets
🖧Traffic Inputs
Full Calculation Breakdown
🖥Equipment / Spec Comparison Grid
📚Reference Tables
| Conversion | Formula | Decimal Result | Practical Use |
|---|---|---|---|
| 1 Mbps for 1 hour | 1 x 3600 / 8 | 0.45 GB | Small stream or sync burst |
| 1 Mbps for 30 days | 1 x 24 x 30 x 3600 / 8 | 324 GB | Always-on low-rate service |
| 100 Mbps for 6 hours | 100 x 6 x 3600 / 8 | 270 GB | Backup or restore window |
| 10 GbE line rate | 10000 / 8 | 1250 MB/s | Internal LAN migration |
| Traffic Pattern | Egress Share | Ingress Share | Planning Note |
|---|---|---|---|
| Remote media streaming | 80% to 95% | 5% to 20% | Outbound bandwidth dominates evenings |
| Cloud photo import | 10% to 25% | 75% to 90% | Inbound capacity determines completion time |
| Offsite backup | 90% to 99% | 1% to 10% | Upload cap and duty cycle matter most |
| VPN work tunnel | 45% to 60% | 40% to 55% | Encryption overhead raises headroom needs |
| Access Type | Typical Down | Typical Up | Home Server Implication |
|---|---|---|---|
| Symmetric fiber | 300 to 5000 Mbps | 300 to 5000 Mbps | Balanced hosting and restore behavior |
| Cable broadband | 300 to 1200 Mbps | 10 to 200 Mbps | Egress bottlenecks appear first |
| Fixed wireless | 50 to 300 Mbps | 10 to 50 Mbps | Latency and peak time variation matter |
| Internal 10 GbE | 10000 Mbps | 10000 Mbps | Storage and backup jobs shift to disk limits |
| Common Project | Peak Egress | Peak Ingress | Likely Monthly Direction |
|---|---|---|---|
| Family Jellyfin / Plex | 25 to 80 Mbps | 1 to 10 Mbps | Egress-heavy |
| NAS cloud import | 5 to 20 Mbps | 80 to 300 Mbps | Ingress-heavy |
| Proxmox image mirror | 200 to 900 Mbps | 100 to 900 Mbps | Mixed burst |
| Security camera archive | 10 to 60 Mbps | 1 to 15 Mbps | Egress-led when offsite |
💡Calculation Tips
When building a home server, expect that you will only need a static IP and some storage. You don’t often find where the problem arises from there. This more often happens when you try to push terabytes to an offsite cloud target as part of a nightly backup script, while also streaming 4K media to your laptop at the same time. Both jobs will want the same pipe. One job pulls data in, the other pushes it out. Consumer broadband plans has very different treatment for each direction. You must understand this split, which is the difference between a smoothly running homelab and a buffering nightmare.
Once you’ve entered your expected usage window(s) and throughput, the calculator above take care of the math for you. It divides traffic into two different buckets: egress and ingress. Outbound is the traffic that leaves your network. That’s when your Plex server streams a movie over cellular data to your phone, or when a friend download a file off your NAS.
Why You Need This Calculator
Ingress is the opposite. It’s the traffic coming in through your doors. Downloading Docker images, syncing photos from your phone, restoring a backup from the cloud… These are all forms of ingress. Because they don’t behave alike in the real world, the tool requires you to specify them separately.
More likely than not, most of your cable connection are asymmetric. You’ll have a gigabit of download speed but only a third different than that (thirty megabits) of upload. The speed of the download lane doesn’t matter; your server sits idle until the upload lane opens back up.
The inputs request your duty cycle, which is perhaps the least-understood metric here. Folks see their peak speed and just presume that’s how fast they’ll run all month long. Nope. That backup task may peak out at a hundred megabits per second, but for how many hours of the day does it do that? Usually not six. It bursts, then throttles back, then pauses again. Duty cycles estimates the percentage of time you’re really pushing/pulling data. From there you can estimate a real-world monthly transfer amount.
To these estimates the calculator adds a little buffer called protocol overhead. It accounts for TCP handshakes, packet headers, and encryption. These are the unseen taxes we pay on data transmission. Small stuff, but important if you’re near your data cap.
On the page, there’s a set of reference tables that lay out typical patterns for common types of workloads. For example, remote media streaming has a lot of outgoing data; your server is the source. But cloud photo imports are nearly all ingress. Before you drop money on hardware, the tool can help you understand in what direction your bottleneck lies.
When your estimated 95% load reaches the limit of your consumer router, you know it’s not your internet plan. It’s the gateway NAT table filling up. That may have been fine for basic web browsing on a cheap router, but it’ll choke when faced with hundreds of simultaneous connection from both a backup agent and a media server. And that’s where everyone trips up. When your device is the bottleneck, they assume it’s their ISP’s problem.
The calculator shows an equipment profile so you can see what that means. Your top-of-the-line consumer box may be less capable than a pfSense-based mini PC firewall, for example. But you’re still limited. If the traffic estimate tell you your gateway isn’t close to being rated for what you want to do, upgrade your hardware first. Then, upgrade your internet plan. Paying for extra bandwidth won’t help if your router is dropping packets before they ever leave the house.
And consider when it’s happening. Model bursty jobs using active hours input. Streaming a movie isn’t competing for bandwidth with a backup job that runs at 2 am. If you do both, though, the calculator will show you how much strain that causes combined. Perhaps your incoming traffic is light and steady all day, but spikes at night. Outbound traffic are high in the evenings, steady otherwise. Knowing the shape of your traffic helps you balance this.
At its core, it’s all about headroom. Does the system stand up to the unexpected? It is like someone trying to send over a giant file while another update downloads. How would it react? The numbers will show whether what you’ve got can take the hit. And if they don’t appear spacious, then there’s a decision to be made: Can you tweak your jobs to schedule them differently? Or do you need to upgrade to a better symmetric fiber? Either way, it’s not hoping for the best; it’s using real data to make a decision. Because you began with a server, and now you’ve got a network plan.