Failover Time Calculator
Estimate service recovery time from health checks, failure thresholds, promotion work, DNS TTL, client reconnect behavior, replay time, load balancer drain, and manual runbook delay.
Failover RTO Results
| Stage | Formula | Typical Home Lab Range | What Reduces It |
|---|---|---|---|
| Failure detection | Health check interval × failure threshold | 3-60 seconds | Shorter interval, sane threshold, local health endpoint |
| Traffic drain | Drain seconds × pattern impact factor | 0-120 seconds | Connection draining, fast backend mark-down, shorter session stickiness |
| Runbook or approval | Manual minutes × automation factor | 0-30 minutes | Pre-approved automation, paging clarity, tested commands |
| Promotion and replay | Promotion seconds + transaction replay seconds | 5-300 seconds | Warm standby, low write backlog, tuned quorum |
| Client recovery | Effective DNS TTL + reconnect + retry backoff | 5-600 seconds | Low TTL, smart clients, connection pool retry tuning |
| Mode | Human Delay Used | Best Fit | Risk to Watch |
|---|---|---|---|
| Manual approval | 100% of runbook time | Risky data promotion, lab changes, first rehearsal | Paging delay and decision latency dominate RTO |
| Assisted runbook | 45% of runbook time | One-click scripts with operator confirmation | Script drift or missing credentials can add hidden time |
| Automatic orchestration | 10% of runbook time | Patroni, Proxmox HA, Kubernetes, HAProxy events | Bad health checks can trigger avoidable failovers |
| Zero-touch HA | 2% of runbook time | VRRP, router, tunnel, and backend failover loops | Split-brain safeguards must be tested under packet loss |
| Pattern | DNS Impact | Drain Impact | RTO Behavior |
|---|---|---|---|
| VIP or router gateway | 0% of TTL | 20% of drain | Clients keep using the same IP, so failover is mostly detection and route move. |
| Database leader election | 10% of TTL | 30% of drain | Stable service discovery helps, but application reconnect pools still matter. |
| Hypervisor HA restart | 0% of TTL | 20% of drain | Boot and service health time dominate when the IP stays with the VM. |
| Kubernetes reschedule | 10% of TTL | 40% of drain | Pod scheduling is quick, but readiness probes and clients can stretch recovery. |
| DNS record cutover | 100% of TTL | 10% of drain | Backend promotion can be fast while recursive resolver cache sets user-visible RTO. |
| Load balancer backend switch | 5% of TTL | 100% of drain | The balancer endpoint remains stable, but old sessions need clean closure. |
| Storage controller takeover | 0% of TTL | 50% of drain | File locks, multipath, and journal replay shape the outage. |
| Manual operator failover | 60% of TTL | 80% of drain | Human confirmation and mixed client caches usually dominate the recovery path. |
| Tunnel or reverse proxy backup | 20% of TTL | 60% of drain | Agent detection and tunnel establishment are usually larger than DNS. |
| Dual-WAN gateway failover | 0% of TTL | 30% of drain | NAT state and client retries matter after the gateway changes uplink. |
| Scenario | Fast Path | Common Bottleneck | Practical Target |
|---|---|---|---|
| Keepalived VIP Pair | Advert miss, VIP move, ARP refresh | Gratuitous ARP acceptance and router cache | 10-30 seconds |
| Patroni PostgreSQL | DCS lock loss, leader election, replica promote | WAL replay and application pool reconnect | 45-120 seconds |
| Proxmox HA VM | Node fence, VM restart, service boot | Boot order and storage mount checks | 2-6 minutes |
| Kubernetes Node Drain | Node not ready, pod reschedule, readiness gate | Image pull, PVC attach, readiness probes | 30-180 seconds |
| DNS Failover | Monitor detects outage, record changes | Resolver TTL and client DNS cache | 2-10 minutes |
| HAProxy Backend Switch | Health check fails, server marked down | Long-lived sessions and retry behavior | 10-60 seconds |
| NAS Controller Failover | Controller heartbeat loss, takeover, replay | NFS or SMB reconnect and pending locks | 30-180 seconds |
| Cloudflare Tunnel Backup | Tunnel probe fails, backup connector active | Connector startup and origin health checks | 20-90 seconds |
This calculator estimates recovery time objective for planning and rehearsal. Measure actual outages with logs from the monitor, orchestrator, load balancer, DNS provider, application, and client retry layer.
You build a highly available stack to power your home lab. When you need it most, it falls over. Primary goes down. Secondary comes back online, but does nothing. Packets gets lost. You look at the loading screen. Reality bites and the recovery time isn’t what your hardware dictates. It’s usually someone waiting for their coffee or a DNS cache.
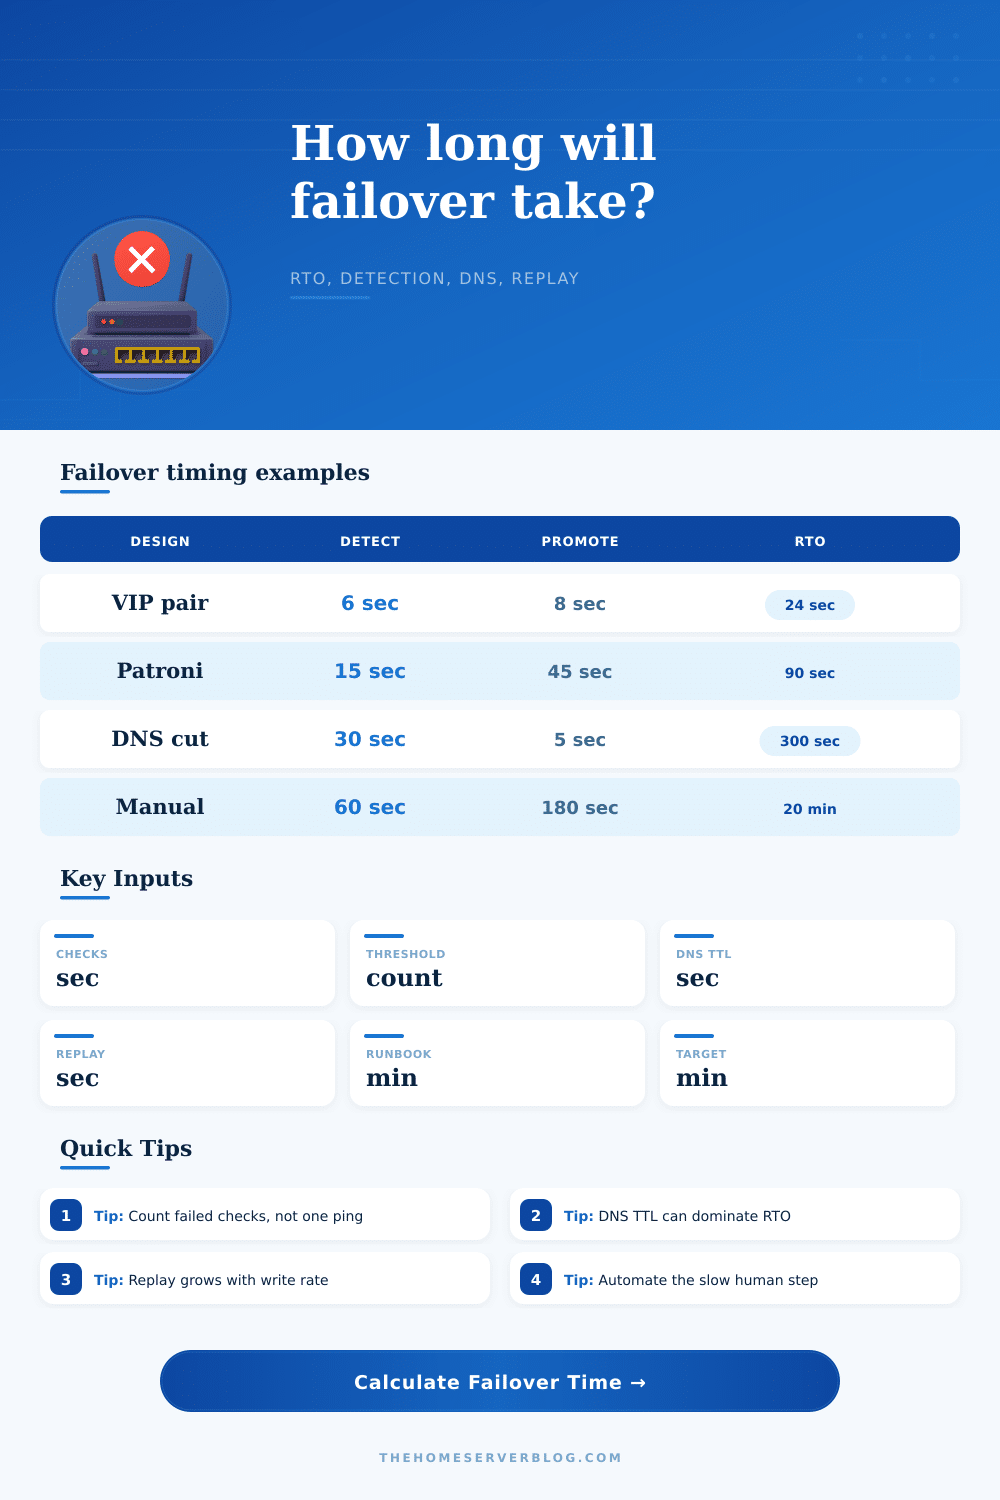
You don’t need a calculator to do the maths, but knowing how those numbers arrive is far more important then the total. The first problem is detection. Health check are not an on/off switch; we imagine it should be. Instead, its running a probe every couple seconds, and if it miss three times, then only at that point does it declare something has failed. This means that by the time it wants to do something, it has been six second since its last probe. Make that lower and you’re faster…but now you risk noise. You don’t want your cluster to promote a new leader when your network hiccuped for a heartbeat, just because there was a dropped packet. So here’s the tension between speed and stability in most HA designs.
Why Your Backup Server Is Slower Than You Think
Finally, there’s the promotion itself. Moving a VIP is fast, but booting a VM is not. That’s why the calculator allows you to set the promotion time, taking into account how your architecture work. For example, with Patroni running PostgreSQL, an election will take 15 seconds. But if you’re rebooting a guest in a hypervisor, that can be many minutes. The input makes you confess what you actualy do when you restart something. I see a lot of people thinking that their backup server is hot and running. In reality, it’s often asleep and cold.
This second layer of complexity is DNS and no one sees it coming. Promote a database in ten seconds, but your users will still get an error because their client resolver has cached the old IP address for three hundred seconds. By comparing DNS TTL against your traffic patterns, the tool brings this to light. DNS doesn’t matter much if you’re moving between backends behind a load balancer. But it controls the whole recovery time if you’re cutting over domain records. Most people miss this when planning their RTO.
The slowest variable in the room? Human intervention. A manual runbook step adds minutes to your outage. An assisted approval process also add delay. Automation factors are applied to decrease this delay and reflect how much of the decision you’ve pre-approved for yourself. Your need for a thumbs up from an engineer at 2 AM, is part of your recovery time. Often the most useful change you can make is automating that approval.
But how servers behave is only half the story: clients also matter. Load balancers don’t immediately kill connections (that would lose data!), but instead drain them. Browsers will hang on stale TCP sessions. Apps will keep trying connections with exponential backoff until they work. And these behaviors are there to protect data integrity, but at the expense of speed. Because nobody’s connected again, a perfectly healthy backend could still make a frontend look broken. This tool has inputs for those kinds of things too: reconnect time and retry backoff, which are very real obstacles.
This is all laid out pretty clearly in the reference table on the page which lists typical ranges for various technologies. It serves as a good reminder that DNS cutover is measured in minutes and VRRP failover is measured in seconds. Knowing where your architecture fits based off that spectrum will help you set realistic expectations. You can’t force a DNS record to update faster than its TTL without breaking caching entirely. But you can tune your health check intervals or warm up your standby nodes.
Buying all that fancy equipment isn’t really planning for failure. Planning for failure is mostly managing your expectations. The seconds spent recovering originate somewhere. These are the seconds spent in boot processes or stale caches. These are the seconds it takes to detect something. If you know where the biggest waste of your time is, you can optimise well. Spending 1% less every place results in diminishing returns. Go after the bottleneck.
A number isn’t enough. Pressing calculate should tell you more than a number. It should give you a map of where you are weak and where you are strong. You can tweak your approval thresholds or automate them. Or even where your actual recovery bottlenecks is. Because that’s what matters, the goal is not zero downtime, because that is a myth. What matters is knowing exactly how long the lights are going to be out when they do go out.