SLA Calculator for Home Servers
Estimate uptime targets, allowed downtime, error budget burn, incident exposure, and support impact for a self-hosted service or home lab.
⚡Home Lab SLA Presets
🛠SLA Inputs
Service Level Results
Breakdown
📊Equipment Spec Grid
🗃SLA Downtime Allowance Table
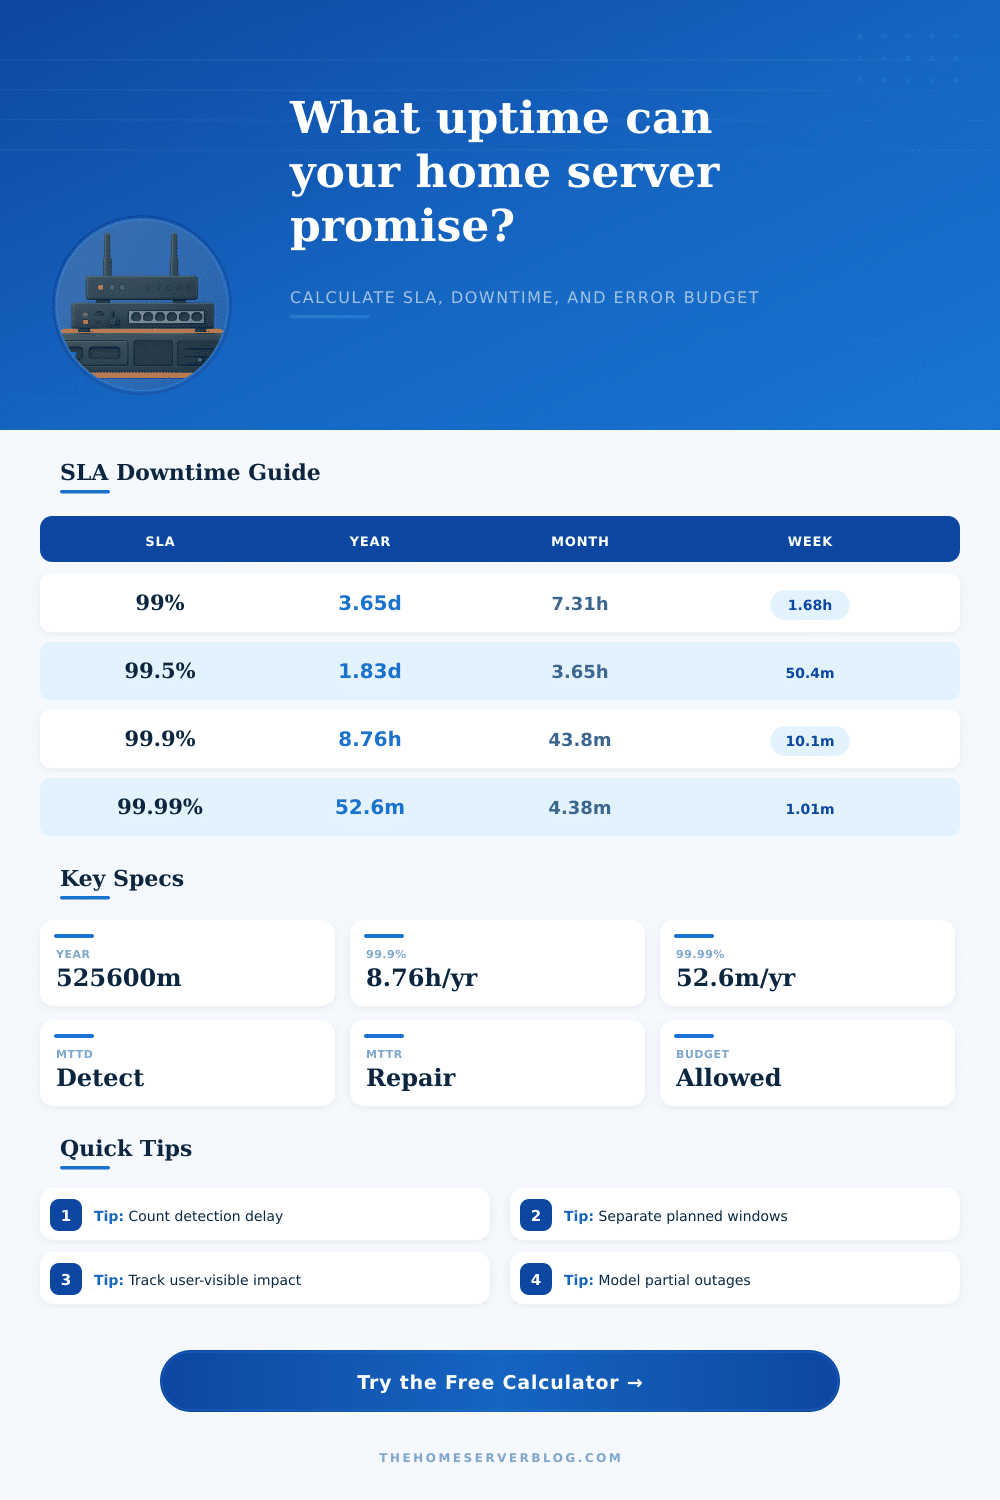
| Target SLA | Allowed per Year | Allowed per 30-Day Month | Allowed per Week | Best Fit |
|---|---|---|---|---|
| 99% | 3 days 15 hours 36 minutes | 7 hours 12 minutes | 1 hour 41 minutes | Personal labs and test services |
| 99.5% | 1 day 19 hours 48 minutes | 3 hours 36 minutes | 50 minutes | Media services and family apps |
| 99.9% | 8 hours 46 minutes | 43 minutes | 10 minutes | VPN, automation, public blog |
| 99.95% | 4 hours 23 minutes | 21 minutes | 5 minutes | Remote work and shared apps |
| 99.99% | 52 minutes 34 seconds | 4 minutes 19 seconds | 1 minute | DNS, identity, external status |
🔧Service Profile Reference
| Service Profile | Typical Target | Main Failure Path | Useful Control |
|---|---|---|---|
| NAS or file server | 99% to 99.5% | Disk pool, PSU, update reboot | Snapshots, UPS, tested restores |
| Home automation | 99.5% to 99.9% | Host reboot, radio bridge, database | Local control, watchdog, spare coordinator |
| Gateway or VPN | 99.9% to 99.95% | ISP, firewall, DNS, certificate | Dual WAN, config backup, external checks |
| Public web service | 99.9% to 99.99% | Reverse proxy, host, DNS, renewal | Health checks, CDN, scripted deploys |
| Virtualization cluster | 99.9% to 99.99% | Shared storage, quorum, switch path | HA policy, fencing, N+1 capacity |
| Monitoring and alerting | 99.95% to 99.99% | Single collector or alert channel | External heartbeat, second notifier |
🔗Redundancy and Detection Multipliers
| Model | Calculator Effect | What It Assumes | Watch For |
|---|---|---|---|
| Single host | 100% outage exposure | One box or one network path | Maintenance counts immediately |
| RAID or mirror | 85% outage exposure | Storage fault tolerance only | Controller, OS, and power still matter |
| Warm standby | 55% outage exposure | Manual failover or restored service | Runbooks and DNS TTL delays |
| Cluster failover | 35% outage exposure | HA can restart workloads elsewhere | Shared storage and quorum risk |
| Off-site secondary | 25% outage exposure | Traffic can move to another location | Data lag and split-brain controls |
📝Common Home Lab Scenarios
| Scenario | Target | Typical Budget | Planning Note |
|---|---|---|---|
| Personal NAS | 99% | 3.65 days/year | Backups matter more than aggressive uptime |
| Home Assistant | 99.9% | 8.76 hours/year | Local fallback avoids high user impact |
| Family apps | 99.95% | 4.38 hours/year | Schedule patch windows and communicate |
| Public blog | 99.9% | 43 minutes/month | CDN and external uptime checks help |
| Critical DNS | 99.99% | 52.6 minutes/year | Use multiple resolvers and off-site health checks |
💡SLA Planning Tips
This calculator is a planning model for home labs and small self-hosted services. It estimates user-visible downtime, not a legal service contract.
Operating a home server involves making a promise to the individuals who use that server, individuals that may include yourself or your family member. A person may use your home server to create a file share, for instance, or they may use it to create a smart home hub. Each of these requirement involve some degree of decision to be made about issues like data backups, monitoring requirement, or how often the cook should replace the hardware for the server.
Each of these factor will influence the reliability of your home server. Many individuals will target an uptime percentage for their home server, perhaps aiming for the same 99 percent or 99.9 percent uptime that a commercial website represents. However, it is important for each of these percentage to be translated into actual minutes of potential downtime.
How to Calculate Downtime for Your Home Server
For instance, a power glitch or software update may result in the loss of all of the allotted downtime for the year. The calculator that is provided in this article permits users to mathematically determine the number of minutes of downtime that will result from factor like the type of service that the server offers, the number of individuals that will use that server, and how quickly any issues with the server can be resolved. Each of the factors that must be entered into the calculator represent different element of the home server.
For instance, the detection time for downtime must be entered into the calculator, as the server may sit in a down state for several minutes before an individual that utilize the server becomes aware of its downtime. The repair time for the server must be entered into the calculator because the repair time is the amount of time that will be required to restore the server to its normal state. Additionally, factors like redundancy and monitoring must be accounted for because redundancy will impact how many minutes of downtime occur as a result of server failure, as well as how quickly the monitoring system will be able to detect any issues with the server before the individuals that utilize the servers report them.
Finally, factors like planned maintenance must be considered. For instance, individuals may not count maintenance into the uptime percentage for the server; other individuals may count every single minute of maintenance to restore the server to its optimal performance to the total amount of uptime that the server provide. The calculator allows for each of these option to be entered, permitting each individual to determine how they will count maintenance in their uptime percentage.
They may choose to perform maintenance during a family movie night, or they may choose to perform maintenance during the weekday afternoon. Each option will impact how much of their error budget they have left for any particular month. An error budget can be established for any home server to aid in management of the server.
The size of the error budget will indicate how many minutes of downtime the target uptime percentage for the server will allow. This error budget will allow owners to determine if they have enough downtime to make change to the server or if they will need to delay those changes. Additionally, if there is a partial outage for the server (where the server is still operational but not at full performance) will consume some of that error budget.
The tables referenced in the article provide downtime percentage for different level of uptime for servers… Percentages ranging from 99 percent to 99.99 percent uptime. Additionally, each table includes the target uptime range for different type of servers, allowing for a comparison of uptime percentages for home server operators relative to each other.
For instance, servers that are used for personal data storage will have different uptime percentage than servers that are used as DNS (domain name system) servers, as the DNS server will be required to be up and running for each of the device within the house. These tables allow for individuals to remember the different percentage without having to memorize the mathematical equation that would provide these percentages. Both monitoring and redundancy for servers can interact with each other in specific ways.
For instance, good monitoring system will help to reduce the detection time for any issue with the server, but will not change the rate of failure of the hardware that is used within the server. Additionally, redundancy will reduce the impact of a single failing server component, but will increase the complexity of the server itself. Any increased complexity can lead to additional outage.
The calculator allows individual to determine the impact of redundancy on the server after determining the error budget for the server. Some factor that may impact a home server but that cannot be accounted for in the calculator include if the spare part for a server is compatible with the servers firmware, or if the internet service provider is causing an outage during a gateway change. Finally, family members may become more concerned with the availability of a server if it is required for those individuals to perform remote work from home.
The numbers for the calculator should be entered any time that an individual change their home server setup. For instance, if an individual is adding a second host to the server, if they are improving the monitoring of the server, or if the repair time for the server is increasing, they should re-enter the number for the server to determine how many minutes of downtime they will have each month. While the calculator will not prevent any outage from occurring for the server, it will help them to manage the difference between the promise that they made to the individuals using the server versus the service that the server is actualy providing.