Kubernetes HPA Replica Calculator
Estimate Horizontal Pod Autoscaler desired replicas from CPU utilization, pod requests, traffic per pod, min/max limits, stabilization windows, metric lag, and spike pressure.
Pods currently in the HPA target workload.
Average pod CPU utilization from metrics.
HPA targetAverageUtilization value.
Lower bound configured in the HPA spec.
Upper bound configured in the HPA spec.
Container request used by utilization math.
Expected requests per second a pod handles at target CPU.
Current service traffic before spike multiplier.
Delay or window that can slow aggressive upscaling.
Window that keeps higher recommendations before downscale.
Metrics pipeline delay from load to HPA decision.
Expected short-term traffic jump, such as 2x launch traffic.
Current utilization divided by target utilization.
Bounded replicas multiplied by target pod RPS.
Incoming traffic after the spike multiplier.
Total CPU request after bounded scaling.
| Step | Formula | What It Means | Operational Note |
|---|---|---|---|
| CPU ratio | current CPU / target CPU | How far average pods are from the target. | Values over 1 scale up; below 1 scale down. |
| Desired replicas | ceil(current replicas x ratio) | Raw recommendation before configured limits. | Kubernetes uses a tolerance band in real controllers. |
| Bounded replicas | min(max(desired, min), max) | Final HPA-size result after minReplica and maxReplica. | Hitting maxReplica is a capacity warning. |
| Per-pod load | traffic x spike / bounded replicas | Estimated traffic each pod must handle after scaling. | Compare with tested RPS per pod at target CPU. |
| Lag exposure | metric lag + scale-up window | Time where old replicas may absorb new traffic. | More exposure raises transient saturation risk. |
| Preset | Replicas | CPU Target | Bounds | Why It Fits |
|---|---|---|---|---|
| Small API Service | 3 current | 65% | 2 to 10 | Simple service with moderate burst room. |
| Checkout API | 8 current | 55% | 6 to 40 | Lower target protects latency during demand jumps. |
| Queue Worker | 5 current | 75% | 1 to 25 | Workers tolerate higher CPU and slower downscale. |
| ML Inference | 6 current | 50% | 4 to 30 | Headroom reduces request queue buildup. |
| Cost Saver | 4 current | 80% | 1 to 8 | Higher utilization target trades latency for spend. |
| Metric Type | Best For | Weakness | HPA Signal Quality |
|---|---|---|---|
| CPU utilization | CPU-bound APIs and workers | Misses queue depth and external waits. | Strong when requests match real CPU work. |
| Memory utilization | Cache-heavy services with predictable heap | Memory may not fall after load drops. | Useful, but often sticky for downscale. |
| RPS per pod | HTTP workloads with known pod capacity | Needs application or ingress metrics. | Excellent for traffic-driven services. |
| Queue length | Async workers and batch consumers | Needs target backlog per worker. | Excellent for work-conserving queues. |
| Latency percentile | User-facing latency guardrails | Noisy and can lag behind saturation. | Good as a secondary signal or alert. |
| Setting | Common Value | Effect | Risk Tradeoff |
|---|---|---|---|
| Scale-up stabilization | 0 to 60 sec | Can delay adding pods during short spikes. | Too high increases saturation risk. |
| Scale-down stabilization | 300 sec | Prevents rapid removal after brief load dips. | Too low causes replica flapping. |
| Metric lag | 15 to 60 sec | HPA reacts to old utilization data. | Large lag hides sudden spikes. |
| Max replicas | Capacity limit | Caps node, budget, and dependency pressure. | Too low creates hard throttling. |
That leads to platform engineers panicking when error rates are already spiking; the Horizontal Pod Autoscaler only kicks in then. Your pods looks fine with fifty percent CPU usage on paper, so you configure the autoscaler with a 60% target. Before the controller responds to the load, though, the traffic has arrived too fast for the metrics pipeline to report it. By the time it do, the pods is already oversaturated.
Enter your desired utilization bound and current utilization here. The calculator will do the math for you, and you’ll know how many replicas you should of run to avoid a traffic spike.
How to Set Up Autoscaling Correctly
Easy to describe: run your app on a pod. Harder to get right: tune how many pods there should be running (the core mechanism). Here’s how the system works: it looks at average CPU usage and divides it by your target percentage. So if you’re at eighty percent and want to be sixty percent, the ratio say you need more pods to dilute the load. To make sure we have enough capacity, it rounds up.
But real life is not raw math. Real life has lag in numbers. And real life has the delay for pulling an image. It also has the delay for starting a container and passing readiness probes. Those gaps are where application fail.
Most teams target a percentage that is too high. They try to squeeze as much efficiency as they can out of their system until each core are running at 90 percent utilization. That is good for your cloud bill, but it is bad for latency. Then when there’s a spike in traffic, say, a mere twenty percent increase, they don’t have any headroom and the pods starts throttling right away.
You want some breathing room, something to soak up the change. To help visualize this, I created a little tool to show what happens to replicas when you throw a spike multiplier into the mix. Say you’ve got double your normal traffic during a flash sale; will your max number of replicas catch it? Or are you looking at throttled requests?
Latency: Aiming for too much efficiency can look great for cloud bills but it looks terribel for latency. There’s nothing worse than getting stuck on an Amazon checkout page for five minutes. (Actualy, that reminds me: Amazon should learn from Netflix!)
The other lever they tweak (and don’t realize what it costs) is stabilization windows. Flapping occurs if your metrics jitter and adding a delay before you stabilize them eliminates flapping (but it makes you less responsive). It’s a bit of a balancing act because if you put in too much delay you’ll get cold starts instead of CPU saturation. Ideally, you’d have just enough to filter out noise while still responding quickly. Users will hate having to wait for their pod to wake up, after all.
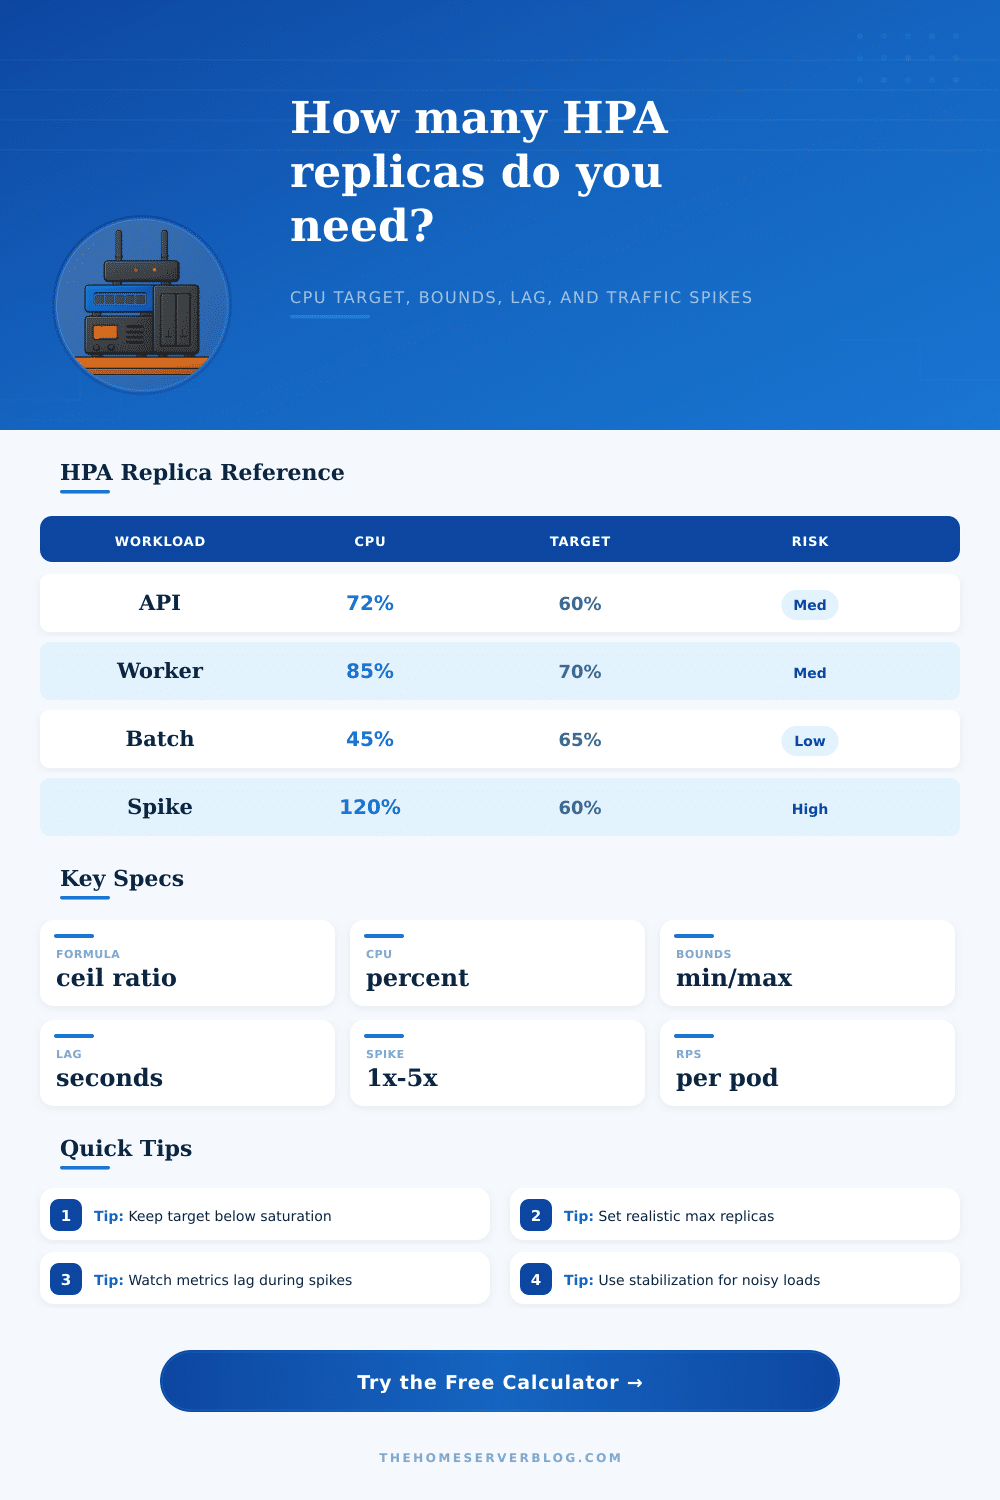
The page has a reference table comparing various types of workloads. These include low-latency APIs that require immediate capacity versus things more tolerant of slower scaling, like a background batch job.
Don’t underestimate the importance of Pod requests. Even if you only ask for a small number of millicores in each Pod (fifty) but your app turns out to use two hundred during load, the utilization metric will report that you’re using one hundred percent long before the CPU actualy maxes out. Because it’s hitting the request limit, the autoscaler decides it must scale out, not because there is suddenly more work. It lead to unnecessary scaling up and waste. Always tune your requests to what you observe in steady state, not to some random proportion of a core.
The problem is that there are issues with using memory metrics: Memory usage tends not to decrease again rapidly. Caches remain available, garbage collection requires some time, etc. If you use only memory-based metrics to autoscale your cluster, you will leave plenty pod running when traffic dies, costing you money for unused capacity. For stateless web services, you’re much better off using CPU as the main metric, since it goes up and down with the load in a more predictable manner.
Lastly, get your bounds checked: getting near max replicas is a red flag that your architecture exceeds its config, i.e., it’s time for either code optimization or cluster expansion. Before you reach a panic-production emergency, plug those limits into the calculator and test their ceilings. We aren’t just preserving pod lives; we’re also maintaining responsiveness without wasting cash. So have some math-guided sanity, set reasonable targets, monitor lag… don’t guess in the dark.