HomeServerBlog microservice scaling tool
Microservice Instance Count Calculator
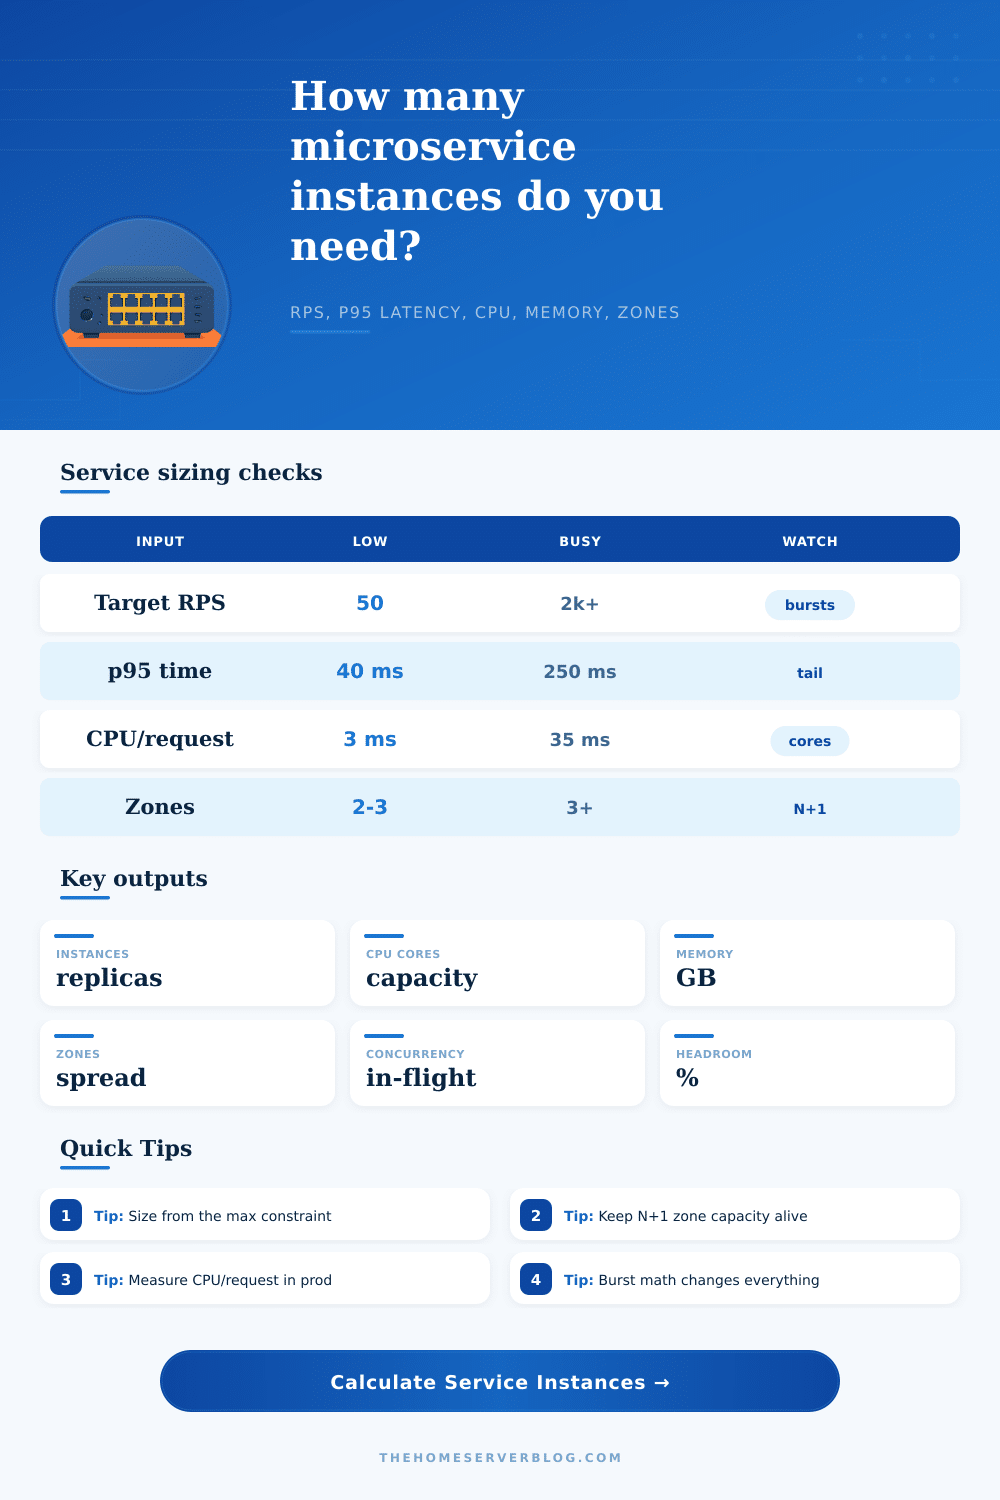
Estimate the replica count, CPU cores, memory footprint, N+1 redundancy, burst headroom, and zone-by-zone placement for HTTP APIs, workers, search services, edge gateways, and backend services.
The larger of CPU, concurrency, redundancy, and zone-floor requirements sets the replica count.
Extra RPS capacity left after sizing to the selected utilization target.
Maximum replicas placed in one zone after an even distribution and remainder spread.
Modeled RPS capacity after the busiest zone is unavailable.
Kubernetes deployment
HPA friendlyUse CPU, concurrency, queue depth, or custom RPS metrics; pair this count with minReplicas and PodDisruptionBudgets.
Container service
Task countTranslate replicas into desired tasks, reserved vCPU, and memory; check service-level health grace periods.
Serverless containers
Concurrency capInstance count is usually driven by in-flight requests and cold-start burst behavior more than steady CPU.
VM or systemd fleet
Process slotsMap replicas to processes per host, then keep spare host capacity for restarts, deploy waves, and zone loss.
| Preset | Typical workload shape | Main scaling signal | Planning note |
|---|---|---|---|
| User API Service | Short HTTP requests, DB reads, cache lookups | RPS and p95 concurrency | Keep enough headroom for login spikes and app releases |
| Payment Worker API | Idempotent API calls with gateway waits | p95 service time and redundancy | Tail latency and retries usually matter more than average CPU |
| Search Service | Query parsing, index reads, ranking work | CPU/request | Separate read replicas from indexing pressure when possible |
| Image Thumbnailer | CPU and memory-heavy transformations | CPU cores and memory footprint | Batching, queues, and caching can cut peak instance count |
| GraphQL Backend | Fanout queries and resolver waterfalls | p95 latency and CPU/request | Use persisted queries and resolver budgets before adding replicas |
| Input | Formula effect | Healthy range | Watch when |
|---|---|---|---|
| Target RPS | Base throughput before burst multiplier | Use measured peak business-hour RPS | Daily averages hide launch and retry waves |
| p95 service time | Peak RPS multiplied by latency seconds gives in-flight requests | Use route-level p95, not full-service average only | External APIs or DB locks stretch tails |
| CPU per request | Peak RPS multiplied by CPU ms gives cores needed | Measure from profiler or container CPU seconds | Serialization, crypto, or image work gets hot |
| Target utilization | Divides usable CPU and concurrency capacity | 50-70% for user-facing services | High targets leave little room for deploy churn |
| Burst multiplier | Scales both concurrency and CPU demand | 1.2-2.5 for many APIs | Autoscaling lag or queue retries compound spikes |
| Sizing driver | Early sign | Calculator output | Adjustment to test |
|---|---|---|---|
| Concurrency bound | Requests queue while CPU is not maxed | Concurrency-driven replicas | Lower p95, raise safe concurrency, or add replicas |
| CPU bound | CPU throttling and latency rise together | CPU-driven replicas and total cores | Optimize hot functions or increase cores per replica |
| Memory bound | OOM restarts or heavy garbage collection | Memory footprint | Raise memory request or reduce per-request buffering |
| Redundancy bound | Small service needs more replicas than traffic suggests | N+1 floor | Keep minimum replicas even when autoscaler wants fewer |
| Zone bound | Uneven failover after a zone outage | Zone distribution | Use topology spread and anti-affinity rules |
| Deployment policy | Replica implication | Failure behavior | Best fit |
|---|---|---|---|
| Single-zone dev | Traffic math plus one spare may be enough | Zone loss is accepted | Internal tools, staging, and low-risk services |
| Two-zone active-active | At least two replicas per zone for smooth deploys | One zone loss can double load on survivors | Small production APIs and home lab clusters |
| Three-zone active-active | Remainder should spread evenly across zones | Survivors absorb the busiest zone loss | User-facing services with normal HA expectations |
| Edge region fleet | Each region often needs a local minimum | Routing can drain failed regions | Latency-sensitive auth, routing, and regional APIs |
| Worker queue fleet | Instances follow queue arrival rate and work duration | Backlog grows instead of HTTP requests timing out | Email, notification, ingest, and async thumbnail jobs |
With the guesswork out of sizing microservices, it’s as easy as math. Most of challenge boils down to having enough instances for amount of incoming requests. That means converting vague worry over capacity into specific numbers of replicas, with a calculator. It uses Little’s Law, which relates how much time requests spends in your system to their arrival rate.
Let’s say you get 1,000 requests per second, and each request lasts 50 milliseconds, that means there are about 50 requests active at any instant. That’s your in-flight concurrency. Now, suppose you determine that one instance can sustains up to 50 concurrent connections without suffering latency. Then you’ll want two instances to keep things humming along. And that’s what the tool does for you automaticly, no more spreadsheet work required.
How to Size Microservices Correctly
But that’s at steady state, which isn’t reflective of real world production traffic. Marketing pushes generate huge spikes. Retry storms, like those caused by failing dependencies, cause spikes too. Those are often much higher than your average metric. To account for this, you must apply a burst multiplier. Otherwise, if you only size for the average, your auto-scaler won’t catch up with demand when it suddenly increases. That will result in delays, errors, and ultimately a loss of user trust during high traffic events. Better to provision just a little extra for bursts then to risk losing users’ trust at critical times.
There’s one more wrinkle: CPU usage. Perhaps a service looks light because it mostly waits around for something, an external API call or database query. However, when it works for you, it may be doing some heavy work like image processing or cryptographic signing. If you only consider concurrency, you could end up provisioning enough instances to handle connections, but not sufficient cores to do the actual computing. The calculator makes this distinction clear, so that you can determine whether your service is idling while it waits for I/O or chewing up CPU cycles when it’s actualy busy working on your behalf. Knowing this distinction prevents you from wasting money on unnecessary replicas.
Math meets real-world use through zone distribution and redundancy. If you think about it, you may find you need three instances for your load, but if you put them all in the same availability zone then you have yourself a single point of failure. If that zone goes down (say there’s a power outage) then so does your whole service. Best practice says spread your instances over at least two or three zones. That often results in having spare replicas which mostly just sits idling. These are your N+1 spares. Your resilience purchase. It costs you some money, but also buys you something, the calculator can help you see that tradeoff by showing the zone distribution and how much capacity you still have after losing a whole zone.
The second constraint is a quieter one: memory. It doesn’t cause a spike in latency right away; instead, it causes a pod to occasionally OOM crash (and restart) or a slow garbage collector pause. The restart confuses autoscaling algorithms and degrades service performance. By setting a reasonable memory request per instance, your orchestrator won’t schedule your workloads on a node without sufficient free RAM. It will avoid “noisy neighbor” problem of competing with another process for RAM.
To conclude. There are no hard-and-fast rules here; size is a repeating process. Estimate, launch the replicas your calculator says you need, observe the results, and repeat. The tools described above provide a reasonable starting point, which will be refined by what happens in production. Begin conservatively on usage ratios so there’s some headroom for expansion. Adding capacity is more achievable than explaining outages. Concurrency, CPU, memory, and redundancy helps create a service that is both fast and stable. Stability ensures the service remains operational during periods of busyness.