HomeServerBlog serverless capacity tool
Serverless Cost Calculator
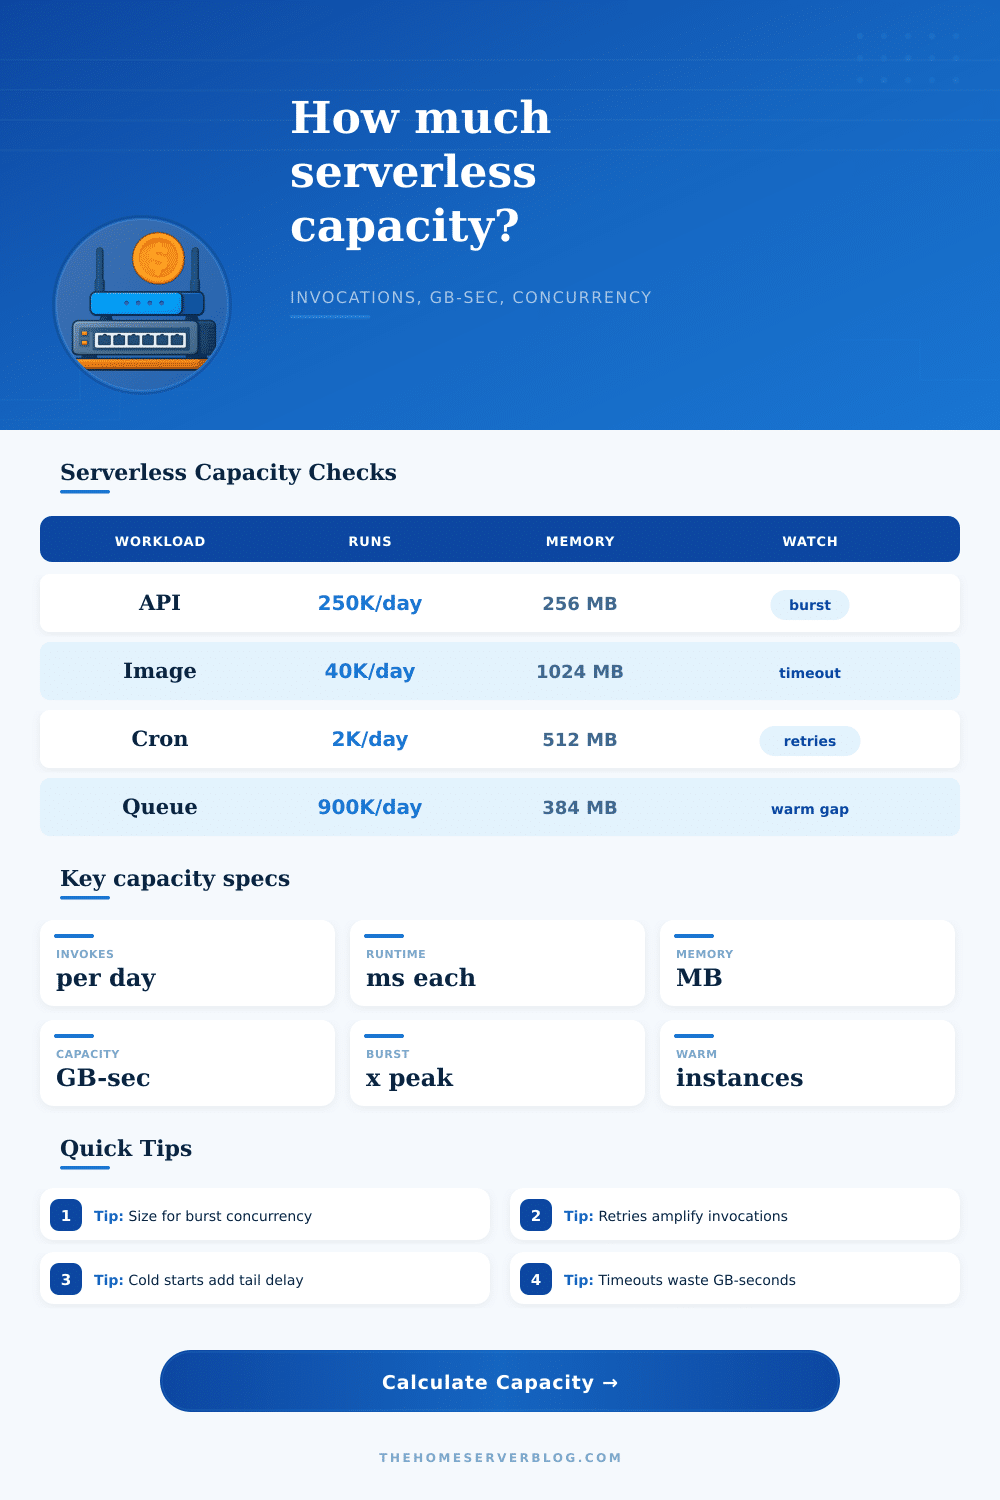
Estimate serverless capacity units without currency: invocations, GB-seconds, peak concurrency, cold-start delay, retries, timeout exposure, response volume, and provisioned warm instance gaps.
Base invocations plus retry amplification before the safety buffer.
Peak concurrency compared with provisioned warm instances.
Flags duration plans that sit too close to the configured timeout.
Quick read on concurrency, GB-seconds, retries, and cold starts.
API function
128-512 MBBest for routing, JSON handlers, auth checks, webhooks, and short database calls with modest response payloads.
Image or PDF task
1024 MB+Transforms often trade memory for shorter duration, so compare GB-seconds and timeout margin together.
Queue consumer
batch drivenConcurrency depends on queue depth, batch size, retry rate, and downstream backpressure more than daily average.
Edge function
low msShort auth, redirect, personalization, and header logic should keep cold starts and payloads small.
| Preset | Typical duration | Memory range | Main capacity signal |
|---|---|---|---|
| API Lambda | 80-350 ms | 128-512 MB | Peak concurrency and cold-start share |
| Image Resize Function | 800-6000 ms | 1024-3008 MB | GB-seconds and timeout margin |
| Cron ETL | 5-90 sec | 512-2048 MB | Timeout exposure and retry amplification |
| Webhook Receiver | 120-900 ms | 128-512 MB | Burst concurrency during provider retry waves |
| Queue Consumer | 300-3000 ms | 256-1024 MB | Warm gap and downstream protection |
| Input | What it changes | Healthy direction | Watch when |
|---|---|---|---|
| Invocations/day | Base request rate and daily GB-seconds | Spread spikes with queues or schedules | Daily average hides a narrow traffic peak |
| Average duration ms | GB-seconds and concurrency | Shorten I/O waits and parse work | Duration exceeds half of timeout |
| Memory MB | GB-second weight and runtime CPU share | Pick the memory tier with best duration tradeoff | Large buffers or transforms force high memory |
| Cold start % | Tail delay and warm capacity need | Keep packages small and reuse clients | Rare routes or many regions stay cold |
| Retries % | Extra attempts and hidden burst pressure | Use idempotency and backoff | Provider retries align with internal retries |
| Concurrency band | Interpretation | Provisioned warm signal | Adjustment to test |
|---|---|---|---|
| Below warm count | Warm pool covers modeled peak | No gap | Lower warm count only after peak traces agree |
| 1-25% above warm | Small cold spillover | Minor gap | Add a little warm capacity or reduce bundle size |
| 25-100% above warm | Cold starts can affect tail latency | Meaningful gap | Raise warm instances or smooth burst sources |
| Above 100% gap | Warm pool is not sized for burst | Major gap | Use queues, reserved concurrency, or scheduled warmup |
| Runtime pressure | Early sign | Calculator output | Planning response |
|---|---|---|---|
| GB-second growth | Memory and duration both rise | GB-seconds/day | Benchmark memory tiers against duration change |
| Burst saturation | Throttles or queue age appears | Peak concurrency | Increase concurrency limit or smooth arrivals |
| Cold start tail | p95 and p99 drift upward | Cold-start delay | Trim dependencies and keep hot paths warm |
| Warm pool shortfall | Provisioned count trails peak | Warm capacity gap | Align warm count with measured burst windows |
| Timeout waste | Retries repeat long executions | Timeout margin | Set shorter internal deadlines and fail fast |
You’re thinking about capacity in the wrong way: That’s why the serverless bill can look so high. You may be thinking about raw invocation counts, but that’s not what drives cost. What does? It is how long your function runs and how much memory it consumes. Memory consumption matter more then number of calls.
Fortunately, the calculator above do the math for you. Just feed in your configured memory size, average duration, and the number of requests per day. The tool will save you from second-guessing whether those milliseconds add up into an unpleasant surprise. It turns all that into GB-seconds, which is what providers actualy charge you.
How to Keep Your Serverless Costs Low
Calling an API handler that reads some JSON may take fifty milliseconds, but it won’t cost much as long as you don’t call it too often. But calling a function that spends three seconds waiting for a database connection while also allocating two gigabytes of memory to process images? Those GB-seconds will stack quick. It’s tempting to provision extra memory just “for safety”. More RAM makes it feel like we’re doing something safe, but it literally increases the weight of each millisecond that your code run.
That’s where it gets tricky with concurrency. Average daily usage is a smoothed-out figure. It blunts the spikes that drive up your bill (or shatter your latency goals). Sure, maybe you can serve 10k requests per day just fine. But what if all 10k come in the same second? Then you’ll need hundreds of running instance, all at the same time. To account for this, you can specify a burst multiplier in the tool. This will simulate a traffic spike hitting your provisioned warm pool. If you need more than your provisioned amount to match peak concurrency, then those extra requests will be cold starts. And as we know, those initial boot-up delays takes up compute resources and sap user experience until runtime finally loads.
Retries have their own hidden tax too. Your function may automatically retry if there’s some kind of network glitch or timeout in a downstream service. In isolation, a three percent retry rate doesn’t sound like much. However, for high-volume workloads, it increases your effective invocation count a lot. That’s why the calculator take it into account as well so you know what your actual system load is.
You’ll find that timeout settings are important here as well. If your average duration is near your configured timeout limit, you’re not only risking having functions fail, but you’re wasting money by leaving them unfinished. A healthy margin ensures they finish before platform shuts them down. On that same page it shows some of the reference tables breaking down common workload types and their typical patterns.
Why is a simple webhook receiver going to act different than an image resizing task? Image processing usualy demands more memory to trade off CPU cycles, reducing duration but increasing per-second cost weight. That will drop the duration while increasing the cost per second. Conversely, webhooks tend to be short lived and bursty. In those cases, raw compute time isn’t as much of an enemy as cold starts. Being able to understand these workloads is vital to dialing in the right inputs.
In theory, it’s easy to say “crank up my concurrency limits and be done with it.” But serverless isn’t like that. If your peak concurrency exceeds your warm instances, then yes, you’ll end up dealing with cold starts. Otherwise, you need to have your warm instances covering your normal peaks. That gives you some headroom in case things go wrong without having to pay for idle capacity at all times. It’s about finding a good balance.
Give enough memory based off what you actualy need to process. Set your timeouts as a safety net but don’t waste resources. Adjust your concurrency levels based on real traffic and not some theoretical maximum. Get all those variables in line and the bill won’t seem mysterious any longer. It will feel like a straight reflection of your usage, it will be easier to manage.