Serverless latency planner
Function Cold Start Cost Calculator
Model how init time, memory size, traffic shape, burst concurrency, provisioned warm instances, retries, and timeout settings affect daily cold-start delay, p95 latency, warm capacity, and compute GB-seconds.
Cold-start breakdown
Runtime init bands
| Runtime family | Typical init band | Cold-start pressure | Home lab or SaaS note |
|---|---|---|---|
| Edge isolate JavaScript | 50 to 250 ms | Low unless bundle is large | Works well for auth checks, redirects, and small transforms. |
| Node.js or Python function | 120 to 900 ms | Moderate with SDK loading | Lazy database clients and smaller packages usually help. |
| Go or .NET trimmed function | 150 to 800 ms | Moderate and predictable | Good fit for webhooks, workers, and API glue. |
| Java Spring function | 1200 to 4000 ms | High during bursts | Plan warm seats for customer-facing paths. |
Traffic pattern cold-start interpretation
| Pattern | Cold percent meaning | Latency focus | Warm strategy |
|---|---|---|---|
| Public API burst | New environments during sudden fan-out | p95 and p99 request latency | Cover expected burst concurrency, not daily average. |
| Scheduled job | Each run may start from zero | Wall-clock completion time | Provision only if schedule is tight or job chains are long. |
| Webhook receiver | Cold starts cluster after quiet periods | Acknowledgement before provider retry | Keep a few warm seats for external retry windows. |
| Admin-only task | Low traffic makes cold starts frequent | Human-perceived wait time | Accept cold delay unless the task gates operations. |
Memory and GB-second conversion
| Memory setting | GB multiplier | 1 second init adds | Calculation use |
|---|---|---|---|
| 128 MB | 0.125 GB | 0.125 GB-sec | Small edge tasks and simple handlers. |
| 512 MB | 0.5 GB | 0.5 GB-sec | Common API and webhook functions. |
| 1024 MB | 1 GB | 1 GB-sec | CPU improves too on many platforms. |
| 3008 MB | 2.938 GB | 2.938 GB-sec | Image, ETL, and heavy framework workloads. |
Timeout risk bands
| Cold latency vs timeout | Risk band | Expected symptom | Operational response |
|---|---|---|---|
| Below 35 percent | Low | Cold starts visible but rarely fatal | Optimize only if customer latency matters. |
| 35 to 65 percent | Watch | Retries appear when downstream calls slow | Trim init and add selective warm seats. |
| 65 to 90 percent | High | Cold requests approach timeout during load | Increase timeout or remove init bottlenecks. |
| Above 90 percent | Critical | Timeouts can cascade into retry storms | Warm capacity and faster initialization are urgent. |
When you hit that serverless endpoint with a ping, did you notice it waited? And then it took an extra three seconds before answering? It’s not because of a network hiccup. Your code isn’t necessarily slow. What you’re seeing is runtime starting up from zero. That wait time is what we call a cold start.
This leads to unexpected compute costs, retry storms, and latency spikes. By plugging in your init times and traffic patterns into the calculator, it do the math for you… No guessing about how many milliseconds add up to what, cumulatively over a month.
How Cold Starts Affect Your Serverless Costs and Speed
Cold starts are something most devs think about in binary way; they’re either there or they aren’t. It’s actualy a range: How many megabytes? Which type of app? And how much sudden activity will it see during concurrency?
Generally speaking, the higher amount of memory configured for your function, the greater amount of CPU power it receive; this often reduces initialization time dramaticly. For example, a Java Spring function may initialize in four seconds when run at lower memory configurations but reduce its initialization time to just one second with sufficient allocated memory.
The downside is that those same GB-seconds will be more expensive while function sits idle or initializing. It’s a balance between reducing latency and increasing the price per megabyte of reserved capacity.
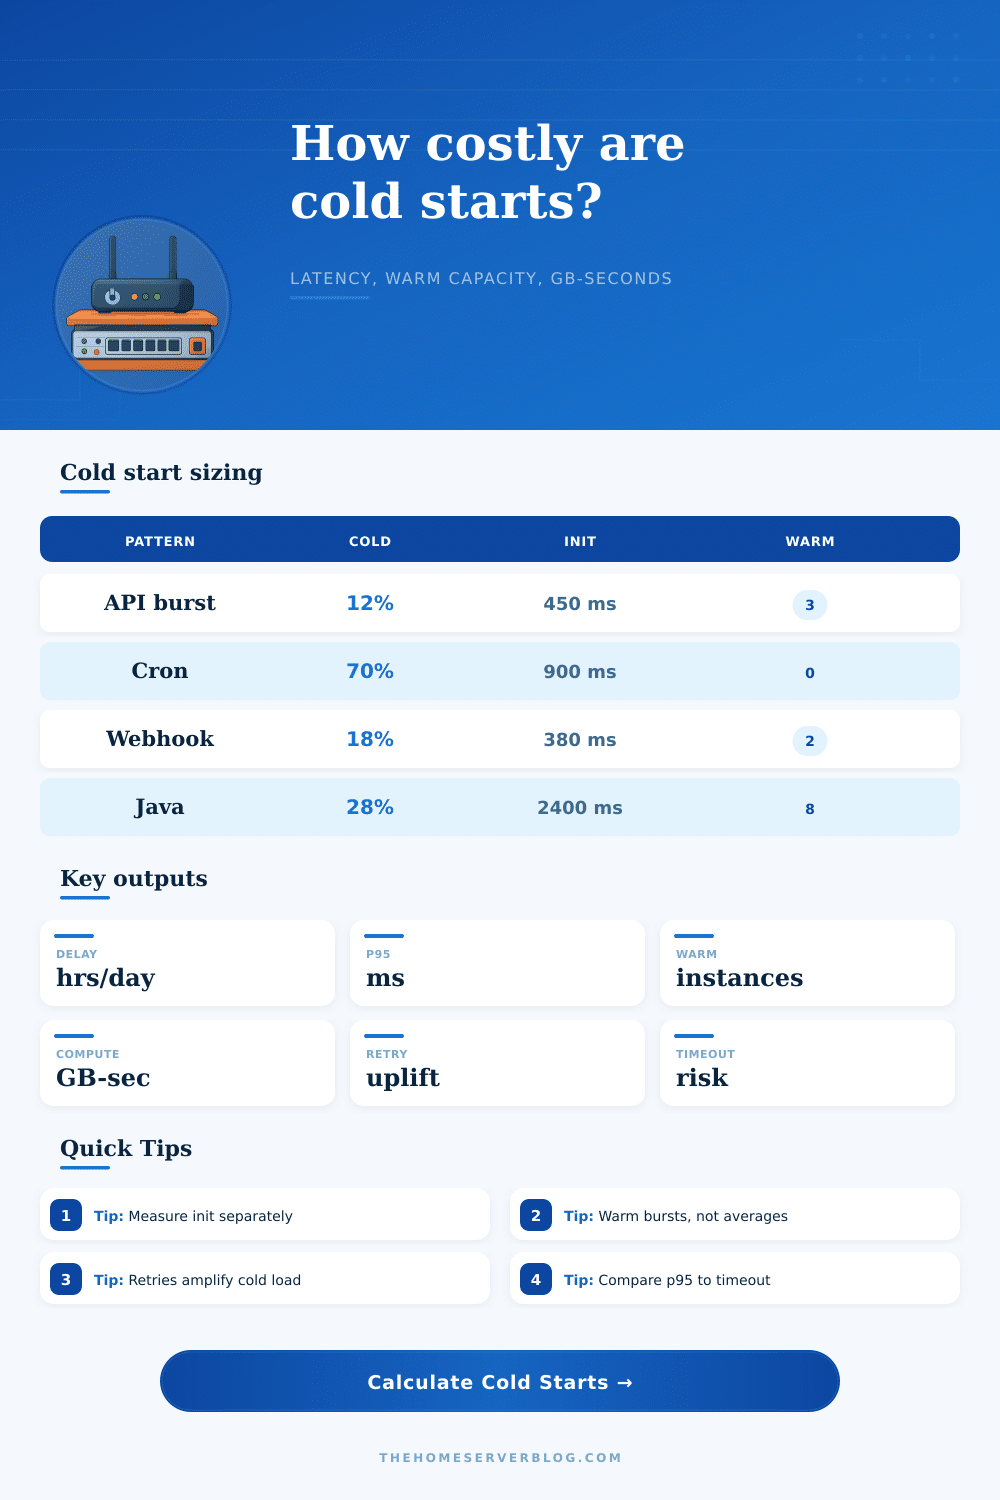
This tool represents reality instead of idealized inputs. For instance, consider observed cold start percent: Do you notice your API endpoints have twelve percent cold starts? That’s probably okay. Does a scheduled cron job experience seventy percent cold starts? There’s no traffic to keep instances warm between runs so it’s wasting initialization every time it fires, and you’re paying for that.
Different traffic patterns vary in how much latency they can handle (which is depicted in the reference table). Internal ETL jobs can get away with longer boot times if they result in cost savings from less provisioning; webhooks require fast acknowledgment or else providers will retry. Small problems at scale turn into big problems because of retries.
Half-a-second init time isn’t a problem for client if it gets an answer back. This continues until it doesn’t, and then it retries. You’ve just tripled the waiting time for users and doubled your compute costs. That’s the kind of thing this calculator models so you can see how a single one percent retry rate increases your daily GB-seconds usage.
Those retries are often caused by aggressive timeouts that weren’t long enough for whatever runtime was being used. If your timeout is five seconds but your cold start takes four, you’re livig on the edge of failure during peak load. Your cold starts take four. At peak load, you’re living on the edge of failure.
The burst problem can be solved by provisioning warm instances, but only if you have foresight. The usual traffic load is flat and boring, so you don’t want to provision for average. You want to provision for the spike caused by completion of a batch job or the drop of a marketing campaign. To figure out how many extra warm seats should of been provided to soak up that spike while avoiding cold starts, the tool asks how big you think the burst size will be in terms of concurrencies.
Under provision and your p95 latency will spike. Over provision and you’re paying for idle capacity. It’s a balancing act between infrastructure waste and your performance SLA.
This leads back to the ceiling: what do your runtime choices involve? Because edge JavaScript functions are small, they can initializes within less than two hundred milliseconds. On the other hand, container-based function must pull images and mount volumes. This adds some overhead that even most optimized code won’t erase. Being aware of these physical constraints helps avoid improving past the point where platform architecture governs the game. There’s no optimizing-away the fact that downloading a gigabyte image is going to take a while. All you can do is work around it (keep instances alive).
So really, it’s not about fast… It’s about controlling costs and being predictable. You’re not guessing anymore; you’re planning for the interaction of retry behavior, memory size, and init duration. You don’t treat latencies as bad luck any more; you manage them as a resource. You’re not trying to eliminate cold starts per se (though maybe that can be a good outcome), but you know precisely when cold starts occur, and what they cost you in terms of user experience or bottom line. This clarity transforms a vague performance issue into a real engineering choice so your serverless infrastructure stays responsive while also remaining affordable even under pressure.