Round Trip Time Calculator
Estimate network RTT from one-way distance, media velocity factor, router and switch hops, serialization delay, queue delay, processing delay, packet size, and link speed.
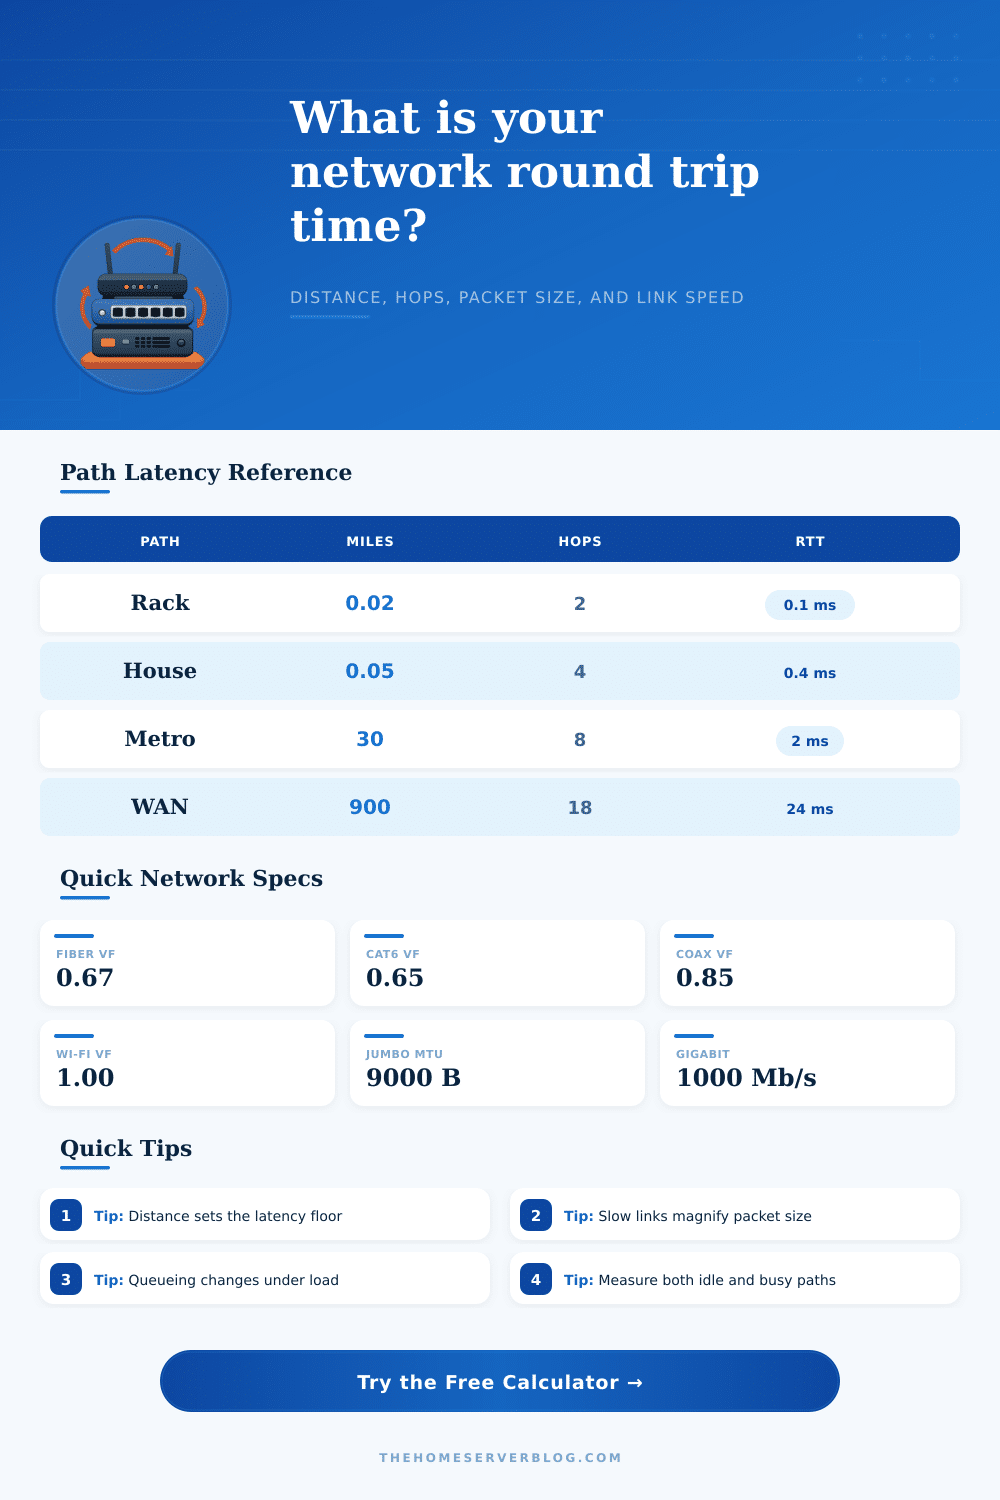
| Medium | Velocity Factor | One-Way Delay per 100 km | Practical Use |
|---|---|---|---|
| Cat5e or Cat6 copper | 0.64 to 0.69 | 0.48 to 0.52 ms | Patch panels, access runs, short building links |
| Single-mode fiber | 0.67 | 0.50 ms | Metro, regional, and long-haul ISP paths |
| Multi-mode fiber | 0.67 | 0.50 ms | Rack rows, building risers, short campus links |
| Coax cable | 0.80 to 0.88 | 0.38 to 0.42 ms | DOCSIS last mile or RF distribution paths |
| Wi-Fi through air | 1.00 | 0.33 ms | Propagation is fast, contention usually dominates |
| Satellite radio | 1.00 | 0.33 ms | Distance to orbit dominates the RTT budget |
| Device Hop | Processing Delay | Queue Delay | Notes |
|---|---|---|---|
| Unmanaged switch | 0.005 to 0.05 ms | 0 to 0.10 ms | Usually tiny unless an uplink is saturated |
| Managed switch | 0.02 to 0.10 ms | 0.02 to 0.20 ms | ACLs, QoS, and buffering add small delay |
| Home router | 0.05 to 0.50 ms | 0.05 to 2.00 ms | NAT, firewall, and SQM settings matter |
| ISP router | 0.10 to 1.00 ms | 0.10 to 5.00 ms | Congestion changes this more than hardware |
| VPN endpoint | 0.20 to 3.00 ms | 0.10 to 5.00 ms | Encryption and encapsulation add overhead |
| Packet Size | 100 Mb/s | 1 Gb/s | 10 Gb/s |
|---|---|---|---|
| 64 bytes | 0.0051 ms | 0.0005 ms | 0.0001 ms |
| 512 bytes | 0.0410 ms | 0.0041 ms | 0.0004 ms |
| 1500 bytes | 0.1200 ms | 0.0120 ms | 0.0012 ms |
| 9000 bytes | 0.7200 ms | 0.0720 ms | 0.0072 ms |
| Preset Path | One-Way Distance | Typical Hops | What It Models |
|---|---|---|---|
| Same Rack Lab | 0.02 mi | 2 switches | Server to switch to NAS in one rack |
| House Cat6 LAN | 0.05 mi | 3 switches, 1 router | Desktop to home server across structured wiring |
| Metro Fiber Loop | 30 mi | 5 routers, 3 switches | Small ISP or city data center path |
| Cross-Country VPS | 1800 mi | 12 routers, 6 switches | Home lab to remote cloud instance |
| GEO Satellite Link | 22300 mi | 6 routers, 2 switches | Ground station through geostationary orbit |
You’re playing an online game competitively and suddenlly your character moves stuttering along virtual landscape as if possessed by a bad animation. You look at your internet speed and discover you have a good download speed but something doesn’t seem right. The disconnect between how responsive you are and what kind of internet speed you have indicate round trip time. It is not how fast you can shove bits into the pipe. It is how far they has to go to get to the server and then return.
Once you know your exact path, put details into the calculator above and it will do the math for you. But knowing what those numbers mean means you don’t waste time chasing ghosts when troubleshooting.
What Makes Your Internet Slow?
Latency have a hard floor: distance. No matter how much money you throw at it, there isn’t anything you can do to reduce latency below the time it takes for light to reach your device. Light is fast, but it isn’t instantaneous when traveling through glass fibers or copper lines. The velocity factor depend on medium and determines how much signal slows down due to propagation delay. Because the glass used in fiber optic cables has certain physical properties that cause light to be delayed a bit, it move at about sixty-seven percent of speed of light in a vacuum. Those fractions may seem insignificant, but they accumulate across hundreds of miles. Depending on location of the data center you’re accessing, the propagation delay could easily total tens of milliseconds even before processing gets started. That’s the physics component you have no negotiating with.
These things get between you, such as routers and switches, are where real headache typically occurs. With each switch or router that your packet encounters, there is additional processing time. It needs to pull it off a one port, read header, look at its routing table, run it through firewall rules, and shove it onto another port. If it doesn’t have to do much, like an unmanaged switch, it is blindingly quick. The more intelligent it gets, the slower it becomes: a router is smart but slow. That reference table on the page details typical latencies per hardware class so you can get an idea of what kind of difference a quiet home switch makes versus a busy ISP edge router.
Add up all the hops and each one seem insignificant, but when you stack up eight or ten hops together, the lag starts to become noticeable. And then we have serialization, which people don’t always understand. It’s how long it takes to actualy put the bits on the wire. Sending a typical packet on a gigabit link only take microseconds. But if you send it across a congested VPN tunnel or slow wireless backhaul, the bottleneck reveals itself. Smaller packets gets sent faster than large ones. Larger frames also mean more time on the wire per hop if you’re streaming high-def video, since those frame will be bigger. While larger packets may be more efficient from a throughput perspective, they can negatively impact latency when crossing slow/shared links.
Queuing delay is the wildcard that makes a good connection bad during peak hours. If there is more traffic going through a link than it can handle, routers begins to buffer packets. They sit in line, waiting for their turn. That’s what happens between three in the morning and eight in the evening, while everyone streams Netflix, your internet feels okay, but is unusable. Rather than fixed hardware specs, queuing delay depend on current network load. The calculator lets you input your estimated queue delay per hop; you’ll need to guess, based off how busy your ISP backbone or neighborhood typically is.
An example of this is the extreme case of propagation delay seen in satellite internet. Just getting the signal from your computer to a satellite in geostationary orbit and back again add about two-hundred milliseconds of round-trip delay due to distance alone. That’s not something you could of get around with faster computers and cleverer queues. It’s also why even when satellites are advertised as fast, they still feel slow.
In conclusion: All of the little waits add up to a round trip. A fraction of those waits are caused by physics; a fraction by hardware; a fraction by traffic pattern. Each wait adds to the overall latency, the number you see when you test your own network. If you know what factor dominates your route, you’ll know how to improve things. You can decide whether to tweak router settings, upgrade your cable, or just accept how far away everything is. The numbers does the sums, but seeing who’s wasting your time lets you know if they can be saved.