RSSI to Distance Calculator
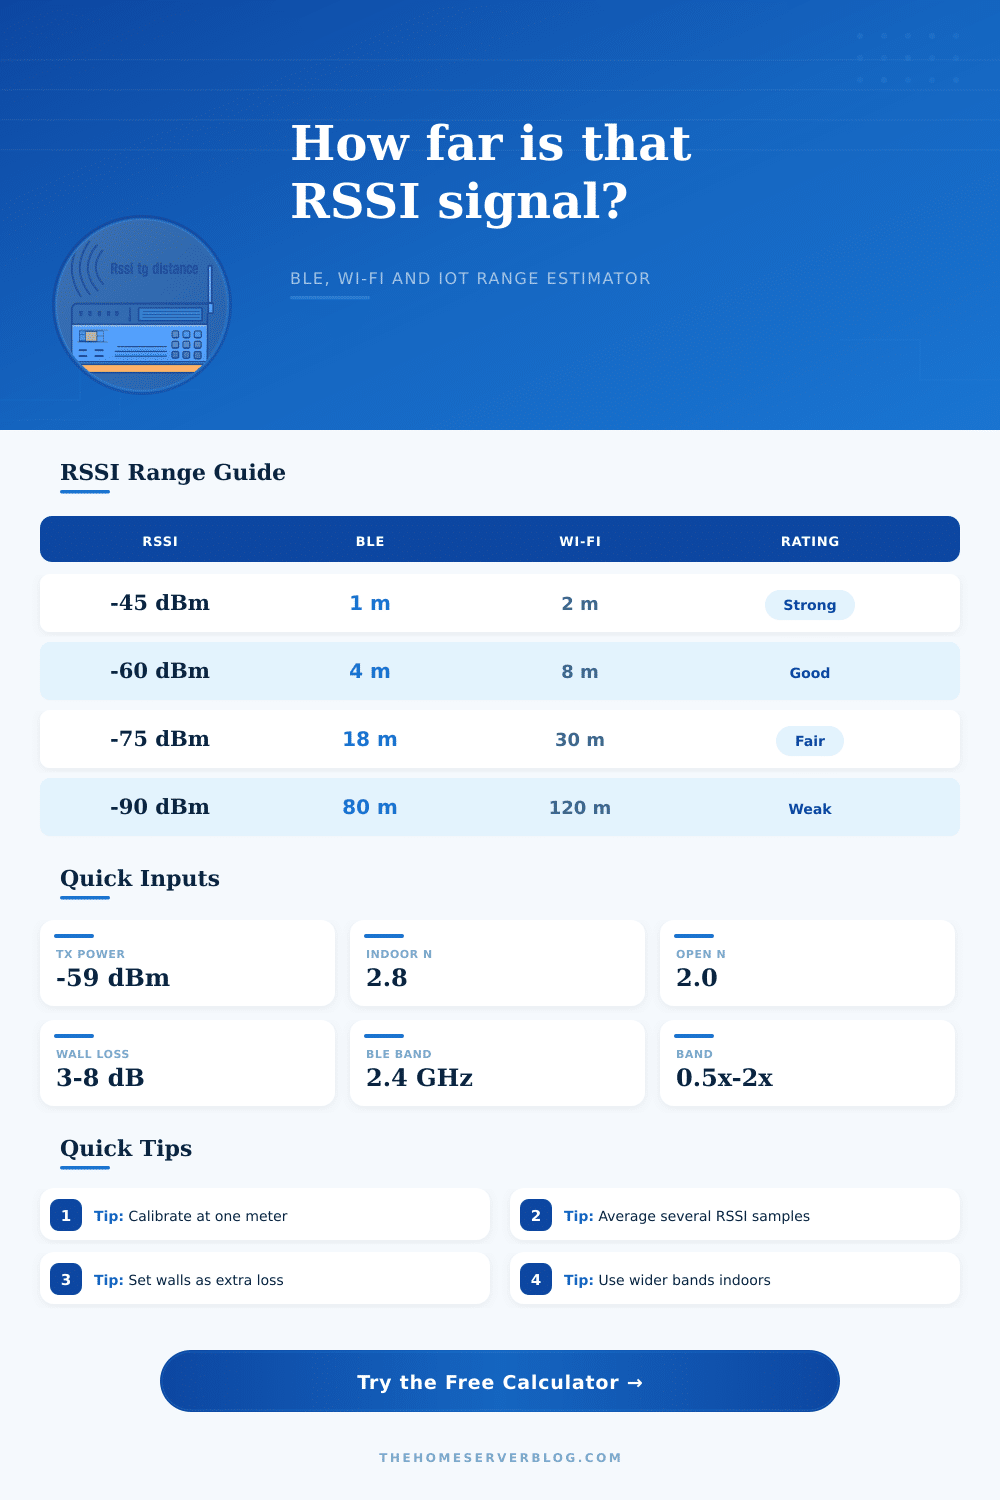
Estimate BLE, Wi-Fi, Zigbee, LoRa and IoT range from received signal strength, calibrated Tx power, environment loss and confidence bands.
📶Named Presets
⚙Signal Inputs
📊Reference Signal Grid
🖧BLE, Wi-Fi and IoT Preset Table
| Preset | Band | Tx@1m | Typical n | Use case |
|---|---|---|---|---|
| BLE Beacon 1 m | 2.4 GHz | -59 dBm | 2.0-2.6 | Proximity beacon calibration |
| BLE Tag Indoor | 2.4 GHz | -65 dBm | 2.6-3.2 | Room-level asset tag estimate |
| Wi-Fi Office AP | 5 GHz | -42 dBm | 2.8-3.5 | Access point distance estimate |
| Wi-Fi Home Router | 2.4 GHz | -40 dBm | 2.4-3.0 | Home router signal ranging |
| Zigbee Sensor | 2.4 GHz | -60 dBm | 2.8-3.6 | Smart-home sensor placement |
| Thread Node | 2.4 GHz | -62 dBm | 2.8-3.4 | Matter or Thread mesh planning |
| LoRa Yard Node | 915 MHz | -48 dBm | 2.1-2.8 | Outdoor IoT yard sensor |
| RFID Shelf Tag | 915 MHz | -35 dBm | 2.2-3.0 | Short-range shelf inventory read |
| UWB RSSI Fallback | 6.5 GHz | -50 dBm | 2.0-2.7 | Coarse fallback when ranging fails |
| ESP32 Lab Test | 2.4 GHz | -50 dBm | 2.0-2.8 | Development board measurement |
🏢Environment Comparison Grid
| Environment | Suggested exponent | RSSI swing | Wall loss to test | Confidence note |
|---|---|---|---|---|
| Open line of sight | 1.8-2.1 | 2-4 dB | 0 dB | Best for distance estimates |
| Home indoor | 2.2-2.8 | 4-7 dB | 3-6 dB | Furniture and walls matter |
| Office indoor | 2.6-3.2 | 5-9 dB | 4-8 dB | People and partitions add fading |
| Retail shelves | 2.9-3.6 | 6-10 dB | 5-10 dB | Metal stock changes readings |
| Warehouse aisles | 3.0-3.8 | 7-12 dB | 6-12 dB | Racks can create deep nulls |
| Concrete basement | 3.6-4.8 | 8-14 dB | 10-20 dB | Use a wide confidence band |
📐RSSI Reference Table
| RSSI reading | Signal meaning | BLE estimate behavior | Wi-Fi estimate behavior | Action |
|---|---|---|---|---|
| -35 to -50 dBm | Very strong | Usually nearby | Same room or close AP | Check if Tx@1m is calibrated |
| -51 to -65 dBm | Strong | Useful proximity zone | Reliable indoor link | Use normal confidence band |
| -66 to -75 dBm | Moderate | Room or hallway scale | Usable with obstacles | Add wall attenuation carefully |
| -76 to -85 dBm | Weak | Estimate widens quickly | Edge of comfortable link | Average more samples |
| -86 to -95 dBm | Very weak | Large error possible | Near receiver sensitivity | Use only as a rough range |
🛠Calibration Tips
When you want to turn on your smart thermostat, you open the phone app, but it’s nowhere to be found. There’s the signal, barely perceptible. You wave around your device like a radar gun, holding it up and waving it here and there, trying to feel out which direction the Bluetooth beacon is strongest. It’s almost like magic.
Except it’s not. It’s all physics. Not that the technology fails; it’s that radio signals don’t behave as if they’re traveling in straight lines through empty space. Instead, they bounce, fade, get scattered by coffee mugs, and absorbed by drywall and furnitures. Guessing at distance based off a signal reading without any kind of context is like guessing at wind speed by how much you have to squint.
How to Estimate Distance Using Signal Strength
That requires a model that captures the messiness of real life. Once we have the raw data, the rest are handled by the calculator on this page, sparing you from having to guess which coefficients is most important. It uses a common engineering approach called log-distance path loss model, under which it’s assumed that the farther away a receiver is, the more signal will drop off predictably.
But those predictable words do a lot of work. The volume of transmission depends on the key variable, and the surrounding environment also affects how that sound travel. This is known as the path-loss exponent. If the signal has an unobstructed line-of-sight, then the signal drops off gradually. Throw in some people, shelves, and walls, and they’ll drop off fasterer. So changing that exponent number by even a little bit can throw your estimated distance by a few meters.
That’s why the tool allow you to choose an environment type. It’s not just a label. It’s a way for you to tell the algorithm what to expect: a clear highway or a cluttered garage.
The other tricky input is transmitter power at one meter. Most folks think their device spits out some standard value, but they don’t! Antennas are all over the map. A high-end industrial sensor may shout; a cheap Bluetooth tag may barely whisper. Use the wrong reference power, and every distance estimate will be off by some fixed multiplier.
Ideally, you’d know what yours was, so if possible, measure it. Grab a receiver, stand one meter away, take an average of twenty readings, and use that real-world number instead of what datasheet says. What happens in a vacuum, the datasheet tells you. In your home/office, there are neighbors and ceilings and pipes. You want data from your actualy space.
Walls matter too. Interior partitions can takes five to eight decibels of your signal. Basement spaces and concrete floors is worse. If you fail to account for this attenuation, the calculator assumes the device is closer than it actually is because the signal looks weaker then it should of be for that distance. Basically, you’re taking the blame (distance) for something that’s actually poor propagation in materials. Adding wall loss as a variable accounts for this. It informs the model that it shouldn’t continue punishing distance for obstructions that have no bearing on how far away the device may be.
Where the tool really comes into its own, though, is with confidence bands. The signal strength is not a fixed quantity; it’s jittery. There are always waves coming in a bit late from multipath interference, canceling themselves out or randomly adding together. One moment you get minus sixty decibels, then minute it’s minus seventy. The averaging of samples will help smooth this noise, but it won’t ever go away completely.
Because there is no precision in wireless situations, the tool return a range instead of a point estimate. If it tells you you’re exactly eight meters away, you might well be off by as much as three; but if it says you’re anywhere between four and twelve meters away, chances are you can actualy do something about that. So there’s no tape-measure reading here in the end; there’s just bounds being set.
It’s not like you’re attempting to locate a missing AirTag in real-time at the centimeter level. You want to know if it’s upstairs or downstairs, inside the house or out in the car, under the bed or maybe behind the sofa. In order to get those bounds correct you need to respect the way radio waves behave in an environment full of stuff.
Radio waves can be finicky, and you’ll never get perfect estimates with zero margin of error. But when you provide the tool with realistic information about your own environment, you stop guessing and instead you know where it is. That’s the difference between waving your phone around blindly versus tracking something down.