Server Downtime Calculator
Estimate availability, downtime allowance, SLA margin, error budget burn, MTTR, MTBF, user-minutes affected, and annualized outage risk for home labs, self-hosted services, storage servers, and small production nodes.
Downtime Breakdown
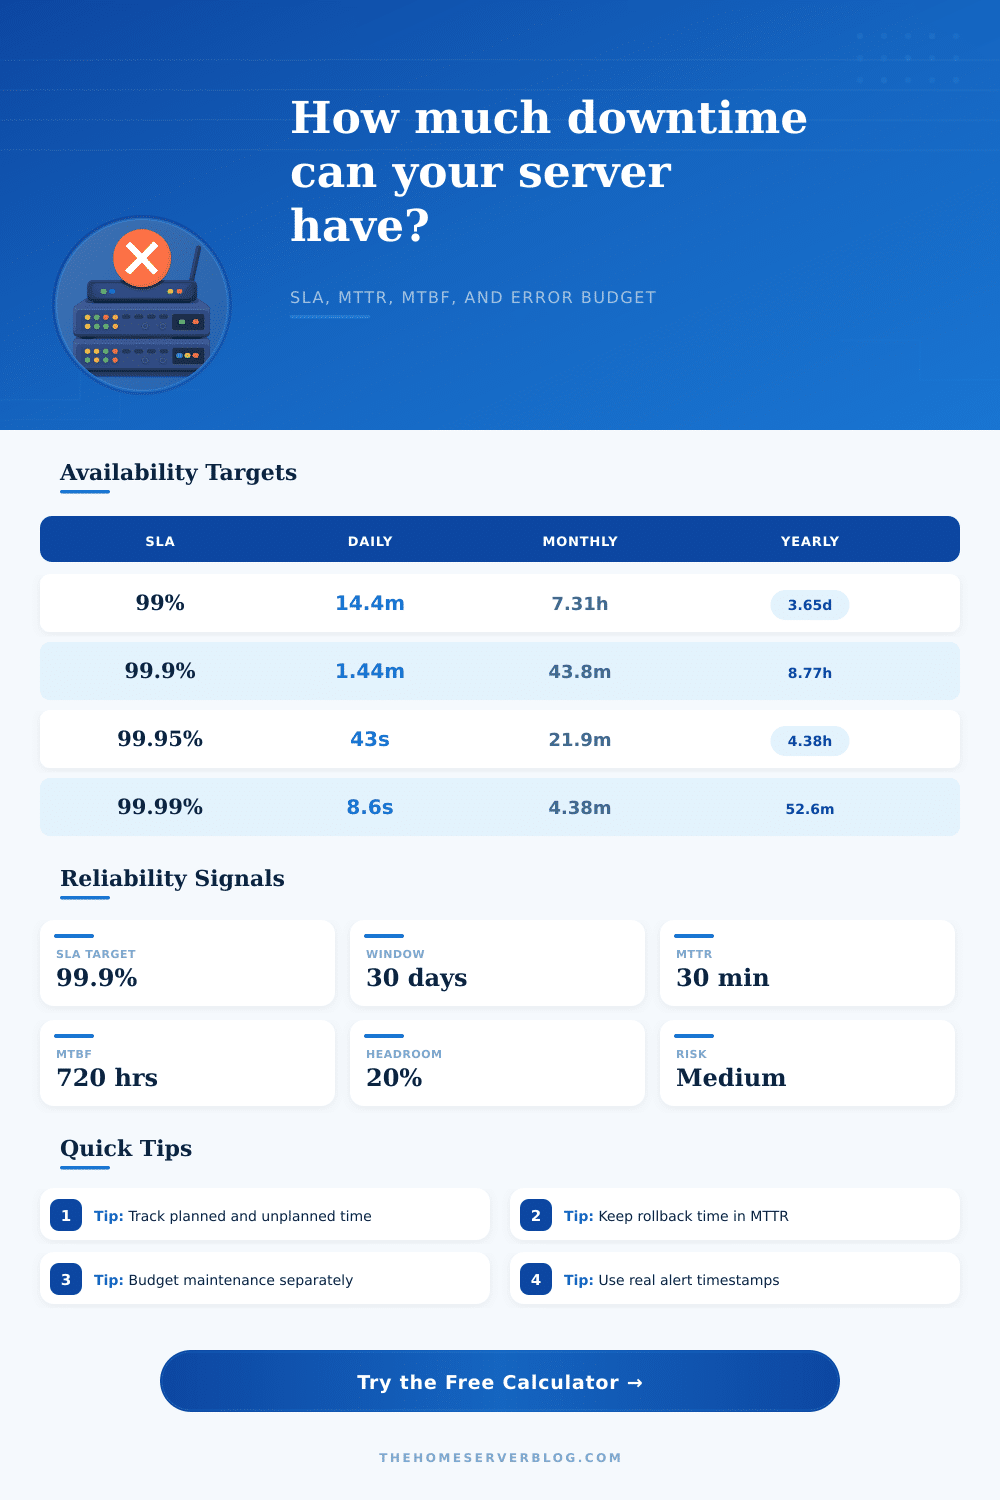
| Availability target | Max downtime per day | Max downtime per 30.44-day month | Max downtime per year |
|---|---|---|---|
| 99% | 14 min 24 sec | 7 hr 18 min | 3 days 15 hr 36 min |
| 99.5% | 7 min 12 sec | 3 hr 39 min | 1 day 19 hr 48 min |
| 99.9% | 1 min 26 sec | 43 min 50 sec | 8 hr 45 min 36 sec |
| 99.95% | 43 sec | 21 min 55 sec | 4 hr 22 min 48 sec |
| 99.99% | 8.6 sec | 4 min 23 sec | 52 min 34 sec |
| 99.995% | 4.3 sec | 2 min 11 sec | 26 min 17 sec |
| Incident metric | Formula used | What it catches | Planning response |
|---|---|---|---|
| Observed availability | (window minutes - counted downtime) / window minutes | Actual service percentage for the selected report period | Compare to the SLA card, not to a vague uptime impression. |
| MTTR | unplanned outage minutes / incident count | Recovery speed after a service-impacting failure | Improve runbooks, rollback, monitoring, and spare-part access. |
| MTBF | available hours / incident count | How often failures repeat within the window | Look for root cause clusters instead of treating every alert as random. |
| Error budget burn | counted downtime / allowance | Whether changes are consuming reliability faster than planned | Freeze risky changes when burn is high and recovery is slow. |
| User-minutes | downtime minutes x users x dependency factor | Human or client impact hidden by a small outage count | Prioritize failover for services with high dependency fan-out. |
| Service pattern | Typical target | Common downtime source | Useful reliability control |
|---|---|---|---|
| Home lab experiments | 99% to 99.5% | Kernel updates, storage tests, and intentional rebuilds | Keep lab DNS, backups, and documentation outside the fragile host. |
| Family NAS or photo sync | 99.5% to 99.9% | Drive replacement, pool scrub issues, and network changes | Separate snapshots, backup jobs, UPS events, and sharing services. |
| VPN, DNS, or router service | 99.9% to 99.95% | ISP changes, firewall reloads, and expired certificates | Use out-of-band access and a tested bypass path. |
| Public web service | 99.9% to 99.99% | Deployments, database locks, and proxy mistakes | Health checks, rollback, canary deploys, and external probes. |
| Virtualization cluster | 99.95% and above | Shared storage, quorum, and maintenance sequencing | Test migration, fencing, quorum loss, and restart order. |
| Common project | Input pattern | Likely result | What to validate |
|---|---|---|---|
| Remote media server | 2 outages, 20 minutes each, 99.9% target | Most monthly budget is already consumed | Transcode service restart behavior and remote alerting. |
| Self-hosted mail | 1 outage, 35 minutes, strict maintenance counting | Close to 99.9% monthly limit | Queue retention, DNS failover, cert renewal, and spam filter startup. |
| Proxmox cluster | Short outages but many maintenance windows | Planned work can dominate the budget | Live migration, storage latency, quorum, and maintenance order. |
| Camera NVR | Few users, high dependency factor, long outage | User count looks small but evidence gap is large | Recording restart, disk health, and time sync after power loss. |
| Public status page | Very low outage tolerance, external checks | Four-nines targets fail from one long deploy | Independent hosting, DNS TTL, and synthetic monitoring locations. |
This calculator is a reliability planning model. Confirm final SLA reporting rules with your actual service policy, monitoring source, maintenance exclusions, incident definitions, and dependency map.
Server downtime is the time between when a service is available and when it is no longer available to it’s users. Server downtime often dont come with a dramatic crash of the server, but instead begins with a quiet loss of access to the service. When users attempt to access a service that is unavailable, they may experience a loading spinner.
The person that are running the service must determine the cause of the downtime. The length of time between the start of downtime and the restoration of the service is the cost of the downtime for the service. You should use the calculator to turn your observation about the cost of your server downtime into a single picture of your current situation.
What Is Server Downtime and How to Measure It
The inputs for the calculator are not abstract; they represent the various decision that you make in the management of your server. For instance, the choice of service profile will reflect the number of people that use your service and the length of time that you will notice when your server break down. A server that provide a home computer lab may experience longer periods of downtime than a mail server that provides email to the members of a household.
Furthermore, your choice of the length of time over which your uptime will be measured will reflect the type of service that you offer. For instance, an IT department that provides uptime to a business may use seven-day time windows to measure the success, while a ninety-day measurement window may reflect a non-profit organization that does not require high uptime measure. Planned maintenance for the server is another category of downtime that is often consider to be “free” time.
However, any time that the server is down for planned maintenance still represents a period of downtime for the server. The decision of whether to include planned maintenance in the measurement of your downtime will impact your target for downtime. Some server administrators may wish to keep planned maintenance outside of their target for downtime, while other may wish to include it in their calculation because there users will not care if the server is down for planned maintenance.
The recovery time for the server consist of two separate phases: detection and repair. Each of these phases can be measured individually, and the length of each phase will have an impact on the total measurement of downtime for the server. Furthermore, you can measure recovery time for the server, and that measurement can be used to compare the level of availability to the allowed downtime for the server.
Reliability headroom can act as a buffer to your allowance for downtime. Furthermore, reliability headroom will ensure that one long outage of your server does not at once cause you to exceed the allowed downtime for the server. For instance, should you set aside twenty percent of your allowed downtime as reliability headroom, you will have a buffer to unexpected outages.
Using a higher level of reliability headroom will make your plan more conservative, which may be desirable if you are making frequent changes to your server. The risk of change is another factor that you must consider in the management of your server. With each deployment of code to a server, there is an inherent risk of introducing another potential outage.
Thus, the risk of change should factor into your projections of the potential downtime of your server. The metrics of mean time to repair (MTTR) and mean time between failures (MTBF) will help to translate the raw number of your downtime into meaningful trend data. For instance, your MTTR will provide insight into whether your recovery process is taking longer to repair outages, while your MTBF can show if you are experiencing an increasing number of outages.
While each of these metrics may not be useful when considered individually, both will be useful when considered together. Furthermore, the table that are provided for MTTR and MTBF will allow you to compare your metrics to common targets for each measurement. One of the variables that can often be overlooked when calculating downtime is the factor of how many other services depend upon your server.
Each server that fails may impact the availability of several other service. For instance, a server that provides virtual private network (VPN) access has a higher factor of dependency than a server that provides media streaming service to a small group of users. The calculation of the number of user-minutes that the failure of your server will impact will help you to understand how critical your server is to your other services.
Furthermore, this calculation will be useful in making decisions regarding the redundancy of your services. The actual number of incidents that occur within your server will not always match the average that are calculated by the calculator. Furthermore, the length of each of those instances may vary.
For instance, one outage may last only five minutes, while another may last three hours when replacing a drive that failed. To account for these varying lengths of outages, the calculator allows you to enter both an average length of outage for your server and a worst-case length of outage. The length of the longest outage will determine whether or not you are within your allowed downtime for the server.
This information is shown separately in the status message of the calculator. While the exact percentage calculated by the calculator may not be that important to you, the conversation that the calculator will inspire between you and others who manage the server is of the most value. For instance, if you determine from the calculations of the calculator that you will miss your target downtime after one more incident, that indicates to you that you must change either your process for recovering from outages or the rate at which you deploy changes to your server.
The opposite decision indicates to you that you have time to breathe before the next outage. Thus, the calculator will allow you to make the moment that the server is lost countable to you and your organization, ensuring that you are aware of how much time and room you have to act, and what option you have to protect that room.