Kubernetes, service mesh, logging, secrets, telemetry
Sidecar Resource Calculator
Estimate the CPU, memory, logs, and equivalent node capacity consumed by injected sidecars before a service mesh, logging agent, proxy, or workload helper quietly becomes cluster load.
Sidecar overhead breakdown
Proxy per pod
Most predictable isolation and policy, but resource use scales directly with pod count and connection churn.
Node daemon agent
One agent per node reduces duplicate memory, but pod-level customization and failure isolation are weaker.
Ambient or shared proxy
Moves traffic handling out of the pod path where supported, often lowering sidecar memory and rollout noise.
Init container only
Good for setup and config rendering because it consumes resources during startup, not steady runtime.
Library instrumentation
Reduces container count but shifts CPU, memory, dependency, and upgrade behavior into application processes.
Gateway offload
Centralizes TLS, policy, and logging at ingress or egress, useful when not every pod needs per-hop control.
| Sidecar type | Starting CPU | Starting memory | Common pressure point |
|---|---|---|---|
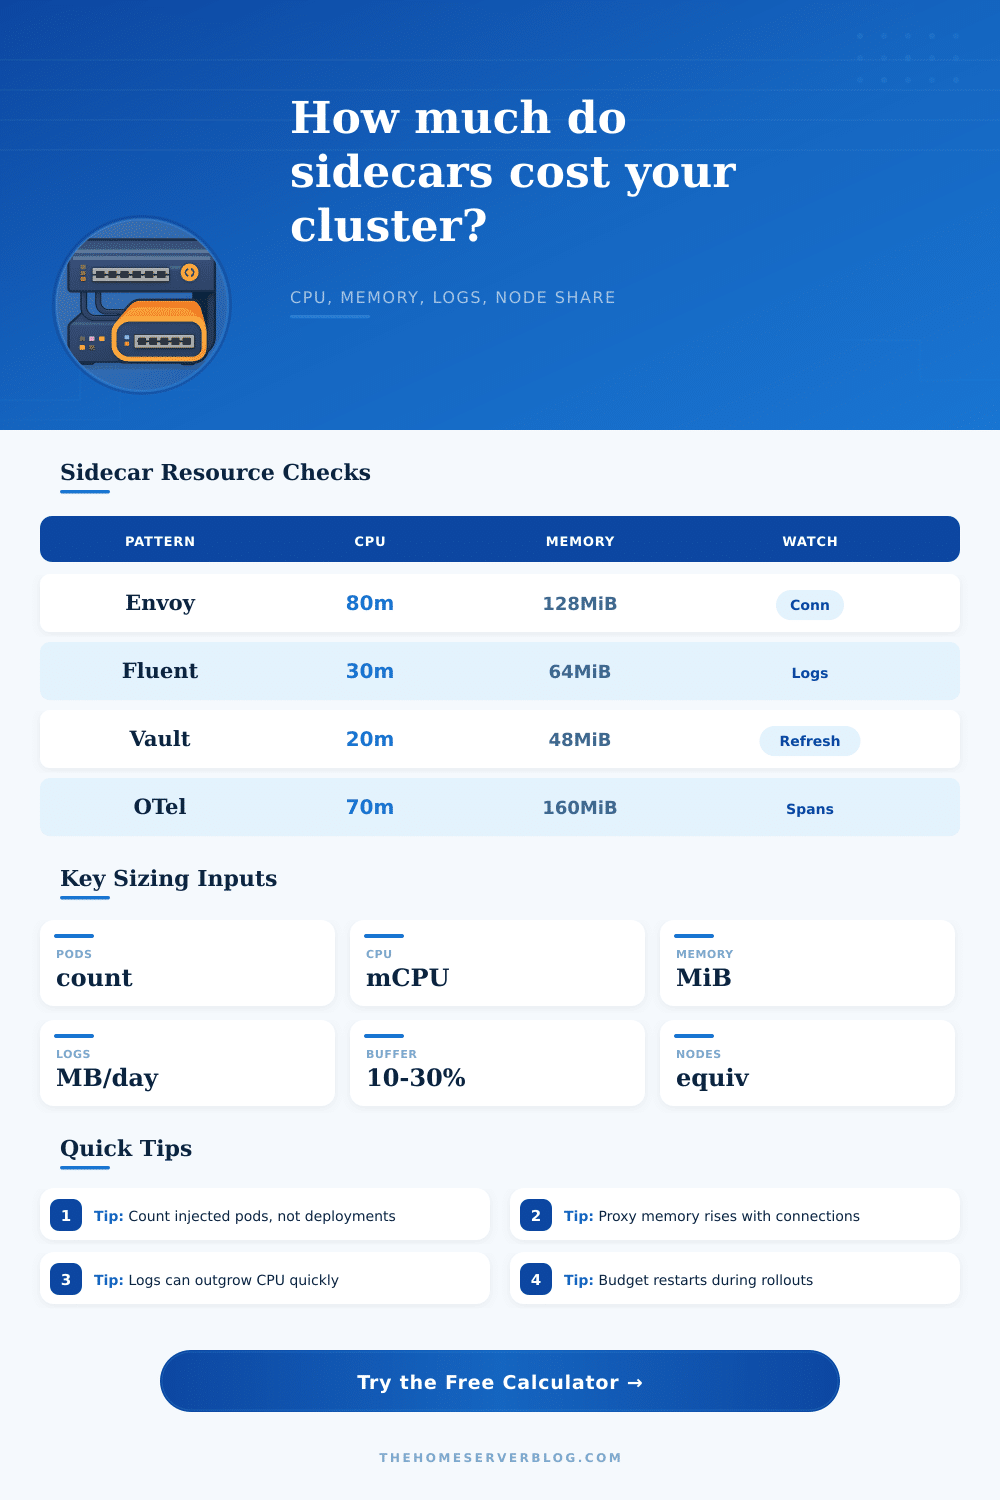
| Envoy proxy sidecar | 60-120 mCPU per pod | 96-192 MiB per pod | Connections, TLS, access logs, and xDS updates. |
| Fluent Bit logging | 20-60 mCPU per pod | 40-96 MiB per pod | Parser rules, multiline logs, backpressure, and output retries. |
| Vault agent injector | 10-35 mCPU per pod | 32-80 MiB per pod | Secret renewal cadence, template rendering, and token refreshes. |
| OpenTelemetry collector | 50-140 mCPU per pod | 96-256 MiB per pod | Span volume, batching, sampling, and exporter retries. |
| Node profile | Raw capacity | Modeled allocatable | Use case |
|---|---|---|---|
| Edge node | 2 vCPU / 4 GiB | 70% CPU, 70% memory | Small remote workers, edge Kubernetes, and tiny home labs. |
| Small lab node | 4 vCPU / 8 GiB | 74% CPU, 74% memory | Light clusters where one heavy mesh can become visible quickly. |
| NUC worker | 8 vCPU / 32 GiB | 78% CPU, 78% memory | Common home lab worker with room for proxies and logging. |
| Dense worker | 32 vCPU / 128 GiB | 82% CPU, 82% memory | Virtualization hosts or production-like lab nodes. |
| Signal source | What increases it | Sizing shortcut | Mitigation |
|---|---|---|---|
| Access logs | Requests, retries, headers, and verbose response fields | Track MB/day per sidecar during peak traffic. | Sample logs or move high-cardinality fields to traces. |
| Metrics | Cardinality from pod, route, user, tenant, and status labels | Telemetry CPU above 20% deserves a measurement pass. | Drop labels and reduce scrape or export frequency. |
| Traces | Spans per request, retries, database calls, and exporter queueing | Collector memory rises with batch and queue size. | Sample at ingress and cap exporter queue depth. |
| Agent status logs | Reconnect loops, auth failures, and config reloads | Restart overhead reveals noisy control plane behavior. | Fix renewals, backoff retries, and reduce debug mode. |
| Check | Healthy target | Warning sign | Planning action |
|---|---|---|---|
| Sidecar node share | Under 10% of allocatable cluster capacity | Sidecars require more than one equivalent node. | Review injection scope and node pool size. |
| Memory requests | Requests close to measured working set | Pods fit on paper but evict during bursts. | Add measured p95 memory plus rollout buffer. |
| Rollout concurrency | Warmup stays below spare node headroom | CPU spikes during cert, config, or proxy warmup. | Lower max surge and spread deployments by namespace. |
| Log pipeline | Daily volume below collector and storage targets | Sidecar logs exceed app logs after mesh adoption. | Sample, filter, and separate debug from access logs. |
Sometimes your Kubernetes cluster slows down, and you can’t figure out why. Everything is fine with the apps, but over time nodes starts to show more usage and there’s no change in the deployment manifests. You haven’t changed a line of code, but now each pod has an extra sidecar tax that makes your infrastructure feel slower. Each secret injector, logging agent or proxy make pods slightly larger, one at a time.
Enter your number of pods and their requested resources into the calculator above and let it work out all the numbers for you… So you don’t have to guess how much they weigh in total (across hundreds of containers). These helpers are designed to be invisible, so it’s easy to forget them. They sit quietly alongside your application, rotating certificates, collecting metrics, and handling traffic without asking for any attention. But just because something is invisible doesn’t mean it’s also weightless.
Why Sidecars Slow Down Your Cluster
One Envoy proxy might look lightweight on its own, requesting a fraction of a gigabyte of memory and eighty millicores. Multiply that by three-hundred pods, though, and now you’re consuming several virtual CPUs cluster-wide; before your application code even executes. You can use the calculator above to let it do the math, but you need to understand what those numbers mean to appreciate why they matter.
The key here is usually memory. Sidecars keep state. They cache route configs, keep TLS handshakes around, and even track connections. The more traffic your app sees, the more memory the proxy will use. Sometimes, this can be unpredictable, you test idling and find a conservative max and then in production, see pods evicted when there’s a spike because the connection tracking table was bigger than anticipated. That’s what those restart overhead and connection count fields is for in the tool, forcing you to think about the production reality of certificate rotations, config reloads, and rollouts which result in transient spikes of higher resource use then the steady-state numbers would indicate.
Another form of pressure comes from log volume. Debug output, trace spans and other access logs build up quickly, especially in sidecars which tend to produce more logs than the apps they serve. Inject a logging agent into all pods? Each with a verbose access log? Your storage costs will climb faster then your compute bills. That’s what the calculator illustrates: How fast can sidecar noise swamp the signal? A little detail, sure, but important if you’re trying to predict long term retention or throughput of your pipeline.
That’s where the true talent comes in, understanding what patterns work (and when not to bother). It doesn’t make sense for each service to run its own telemetry collector or proxy. A daemon running at the node level will often reduce duplication, with one set of memory uses serving multiple similar pod. Moving some of that policy enforcement closer to gateways also takes load off individual microservices. These tradeoffs is shown in reference tables on the page. They show how less granular control means less overhead of shared infrastructure.
How do you strike the right balance between efficiency and isolation? Best way is to measure before you inject. Deploy the sidecars in one namespace, wait a week, and check the metrics. How does actual CPU/memory usage compare with what you estimated? If the actuals are significantly higher than your initial estimates, adjust your baselines now instead of getting the surprise that half your cluster capacity has been eaten up by infrastructure overhead, not user value, when you go big.
Networking, security and observability all depend critically on sidecars, which is incredibly powerful tools. The only thing they don’t do is come free. If you account for their costs up front, they become planned expenses instead of surprises. It’s about being aware of precisely how much your helpers cost you; and whether the cost is worth the benefit.
Having a large enough cluster isn’t about having enough nodes: It’s about knowing what you’ve got running on those nodes. Being able to see the hidden weight allows you to trim the fat while retaining the muscle, letting your infrastructure support your application instead of competing against it. Awareness makes the cluster light.