Shannon Capacity Calculator
Estimate the Shannon-Hartley throughput limit from bandwidth and signal-to-noise ratio, then compare it with noise floor, implementation loss, link margin, and practical coding efficiency.
📶Named RF and link presets
⚙Shannon-Hartley link inputs
Capacity result
🗂Shannon reference grid
📊Capacity reference tables
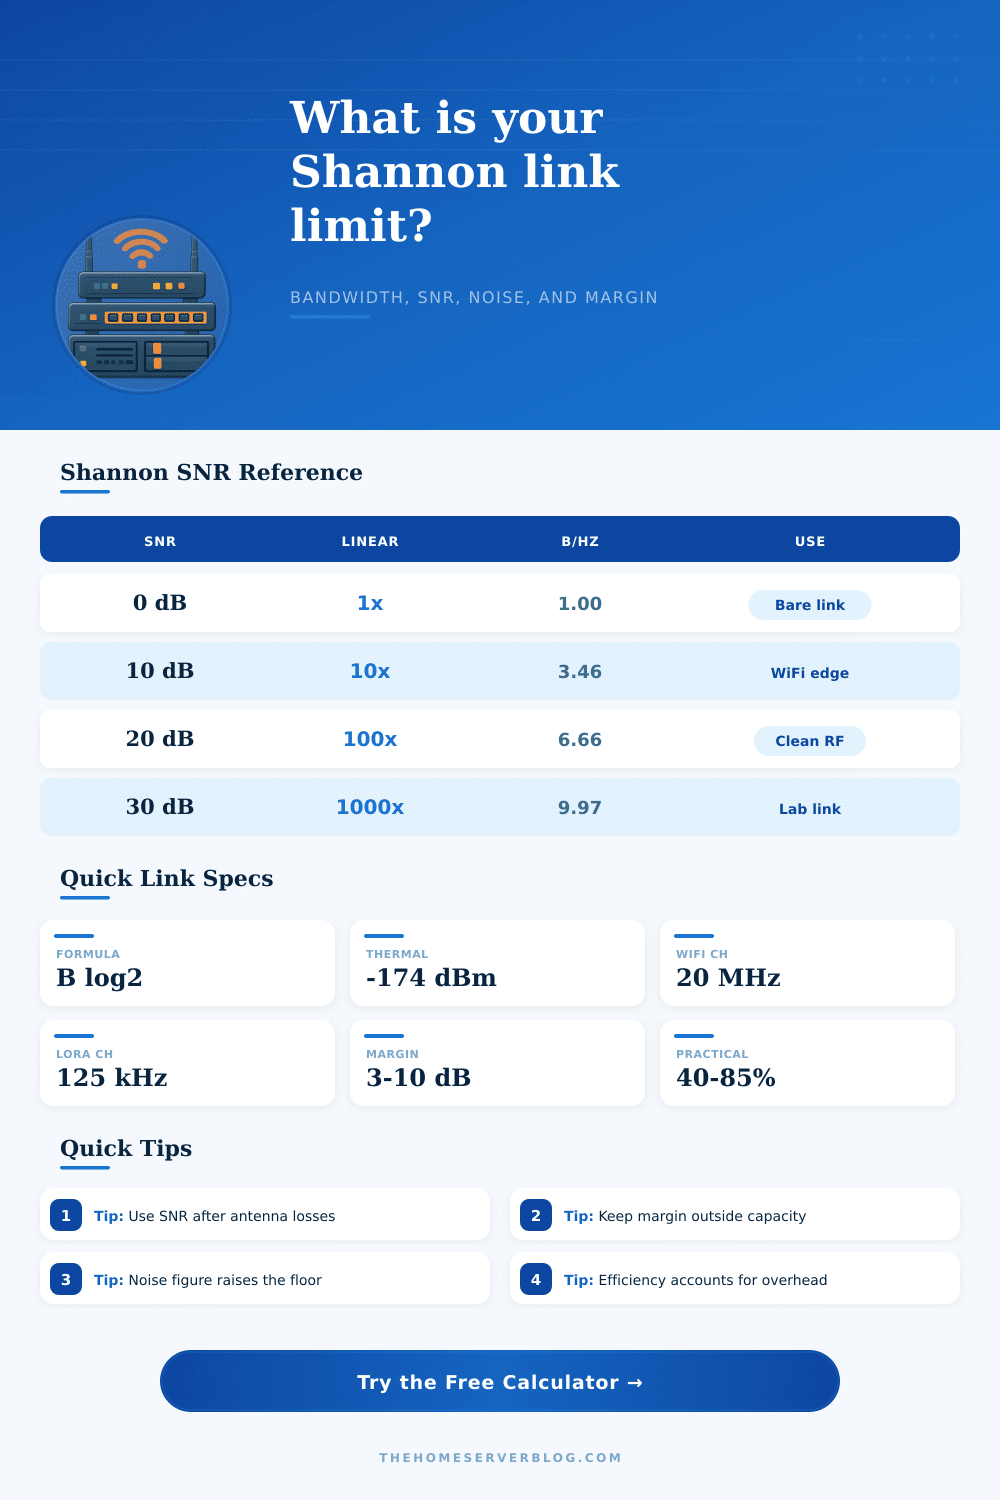
| SNR dB | SNR linear | Shannon bps/Hz | Practical read |
|---|---|---|---|
| -10 dB | 0.10x | 0.14 | Below robust link planning for most payload systems |
| 0 dB | 1.00x | 1.00 | Noise equals signal power; coding must work hard |
| 3 dB | 2.00x | 1.58 | Minimum planning area for simple robust links |
| 10 dB | 10.0x | 3.46 | Usable edge for many WiFi and radio systems |
| 20 dB | 100x | 6.66 | Clean link with room for higher-order modulation |
| 30 dB | 1000x | 9.97 | Excellent lab, coax, or short fixed wireless path |
| 40 dB | 10000x | 13.29 | Very high quality path; hardware limits often dominate |
| Bandwidth | Thermal noise | With 5 dB NF | Common use |
|---|---|---|---|
| 12.5 kHz | -133.0 dBm | -128.0 dBm | Narrowband voice or telemetry |
| 125 kHz | -123.0 dBm | -118.0 dBm | LoRa-style sensor channels |
| 1 MHz | -114.0 dBm | -109.0 dBm | Lab IF or narrow data channel |
| 10 MHz | -104.0 dBm | -99.0 dBm | LTE-style or fixed radio channel |
| 20 MHz | -101.0 dBm | -96.0 dBm | Common WiFi channel width |
| 80 MHz | -95.0 dBm | -90.0 dBm | Wide WiFi or high-rate RF link |
| 160 MHz | -92.0 dBm | -87.0 dBm | Very wide WiFi and lab links |
| Efficiency factor | Typical range | Why below Shannon | Calculator input |
|---|---|---|---|
| Robust IoT / telemetry | 15% to 35% | Spreading, repeats, preambles, long guard time | 20% to 35% |
| WiFi client payload | 35% to 65% | MAC contention, pilots, guard interval, ACKs | 45% to 60% |
| Fixed point-to-point | 55% to 80% | FEC and framing but less contention | 60% to 75% |
| Lab coax or IF path | 70% to 90% | Hardware and coding still need headroom | 75% to 85% |
| ADC sampled path | 50% to 85% | ENOB, quantization, filters, clock jitter | 55% to 80% |
| Preset | Bandwidth | Planning SNR | What to verify |
|---|---|---|---|
| WiFi 20 MHz Edge | 20 MHz | About 10 dB | RSSI, noise floor, retransmits, channel use |
| WiFi 80 MHz Clean | 80 MHz | About 20 dB | Real client MCS and airtime duty cycle |
| LoRa 125 kHz Sensor | 125 kHz | Low or negative SNR | Spreading factor and payload interval |
| 5 GHz PtP Bridge | 40 MHz | About 22 dB | Fade margin and Fresnel clearance |
| DVB-S2 Downlink | 36 MHz | About 9 dB | Rain fade and required Eb/N0 for chosen MODCOD |
| ADC Audio SNR | 20 kHz | About 86 dB | ENOB, anti-alias filter, and clock quality |
✅Planning tips
Every wireless link have a maximum capacity for the movement of data. The maximum capacity of a wireless link is referred to as the Shannon limit. The Shannon limit is the theoretical maximum of the data that can move across a wireless link, and the bandwidth of the wireless link and the signal to noise ratio of the link can determine the Shannon limit.
Enter the number for your wireless link into the calculator, and the calculator will provide you with both theoretical and practical throughput of your wireless link. Bandwidth is one of the primary factors that you must enter into the calculator to determine the Shannon limit of your wireless link. Bandwidth is the amount of spectrum that are available to your signal.
Find how much data your wireless link can carry
The wider the bandwidth of your wireless link, the more data that can move across the link. For instance, an 80 MHz channel will have more data move across the link than a 20 MHz channel. The calculator will convert all units for bandwidth to hertz, and the calculator will remain consistent in its calculations regardless of the bandwidth unit that you enter.
The signal-to-noise ratio is the second primary factor that you must enter into the calculator to determine the Shannon limit. The signal-to-noise ratio is the strength of the signal in comparison to the level of noise being picked up by the receiver. Signal strength and signal-to-noise ratio isnt the same; a signal can be strong but have a poor signal-to-noise ratio if there is a great deal of noise being picked up by the receiver.
You can enter the signal-to-noise ratio in decibels directly, or you can enter the signal power and noise power separately so that the calculator can calculate the signal-to-noise ratio. Additionally, a thermal noise mode is included in the calculator, which starts at -174 dBm per hertz of bandwidth, which is the thermal noise of the air, and adds in the noise figure of the receiver. This mode can be used to calculate the signal-to-noise ratio prior to the installation of the wireless link hardware.
Several adjustments are made to the theoretical calculation to provide the practical throughput of the wireless link. Implementation loss is applied to account for the difference between the ideal modulation of the wireless link and the actual throughput of the link; this is due to issues like filtering of signals and amplifiers. Link margin is subtracted from account for fluctuations in the signal that is received; link margin provide headroom to account for these fluctuations.
Efficiency is applied to account for the data overhead of the wireless link; this data is used for signals like pilots, framing, retransmissions, and protocol header. Throughput will always be less with these adjustments; the practical throughput of a wireless link is the data that will arrive at the link in intact packets. The reference tables included in this article can help to provide context for the throughput calculations performed with the calculator; however, these tables do not replace the measurements of the actual wireless link.
The tables provide information about the efficiency of different signal-to-noise ratios, and the way that thermal noise increase with bandwidth. For instance, the tables allow a reader to understand that a signal-to-noise ratio of 10 dB is sufficient for many wireless applications, but a signal-to-noise ratio of 30 dB will allow for higher-order modulation of the signal across the link. Based off these calculations, you must make decision regarding the design of your wireless link.
For instance, if the throughput of your link is higher than the data that you require to carry, you know that you have extra capacity in your link; this can be used to manage weather condition or future growth in the data to be carried. However, if the throughput is less than the data that is to be carried, you must make changes to the link; the bandwidth can be increased, the antennas can be raised to increase the signal-to-noise ratio, the protocol overhead can be reduced, or the reliability of the link can be decrease. These changes will shift the link from theoretical to practical throughput, and while the calculator will not make these decisions for you, it will make the numbers visible to you so that you can make these engineering decisions for yourself.
While the Shannon limit provides a theoretical calculation of the possible throughput of the wireless link, there are several other factor that can impact the throughput of that link. For instance, adjacent-channel interference will reduce the amount of data that the link receives. Additionally, the power limits that exist for different channels will again reduce the amount of data that is received by the wireless link.
Additionally, the radio cannot transmit and receive on the same channel at the same time. The temperature of the radio will impact its noise figure, and trees in the Fresnel zone will again reduce the amount of signal strength that reaches the link and is received. These factors will impact the throughput of the link, but are not accounted for in the Shannon limit calculation.
By performing the calculations twice, you can compare the throughput of your link with your current setting and with the throughput that you can achieve after making changes to an antenna or channel width. By calculating the throughput of your link with the measurements that you take on site for your link, and then by calculating again with the throughput that you wish to achieve through the alterations to the link, you can determine how much improvement those alterations will make, and how much of the calculated throughput will be lost due to the efficiency and link margin of the link. If the two calculated throughput values are similar, the wireless link is likely near its limit; if they are significantly different, then the next engineering step is clear.
Thus, by understanding the Shannon limit for the wireless link, and by using the calculator to determine the throughput of the link, engineers can avoid guesswork in the design of the link.