HomeServerBlog reliability operations planner
Error Budget Burn Calculator
Estimate how quickly a service is consuming its SLO error budget from request failures, outage minutes, degraded minutes, rolling window length, alert threshold, telemetry source, and reserved deployment headroom.
▣Error budget burn presets
⚙SLO and observation inputs
Formula breakdown
Budget meter
📡Telemetry source comparison grid
Allows 0.1% bad events or bad minutes across the SLO window.
For a 30 day 99.9% time-based SLO.
Common sharp-burn page threshold for short windows.
Useful change headroom for home lab maintenance nights.
📚Error budget reference tables
SLO target versus time budget
| SLO Target | Allowed Error | 30 Day Time Budget | Use Case |
|---|---|---|---|
| 99% | 1.000% | 432 min | Personal media, non-critical lab service |
| 99.5% | 0.500% | 216 min | Shared dashboard or family file service |
| 99.9% | 0.100% | 43.2 min | Remote access, DNS, password vault |
| 99.95% | 0.050% | 21.6 min | Highly visible personal cloud endpoint |
| 99.99% | 0.010% | 4.32 min | Ambitious multi-node home lab service |
Burn rate alert windows
| Alert Type | Burn Threshold | Typical Window Pair | Budget Meaning |
|---|---|---|---|
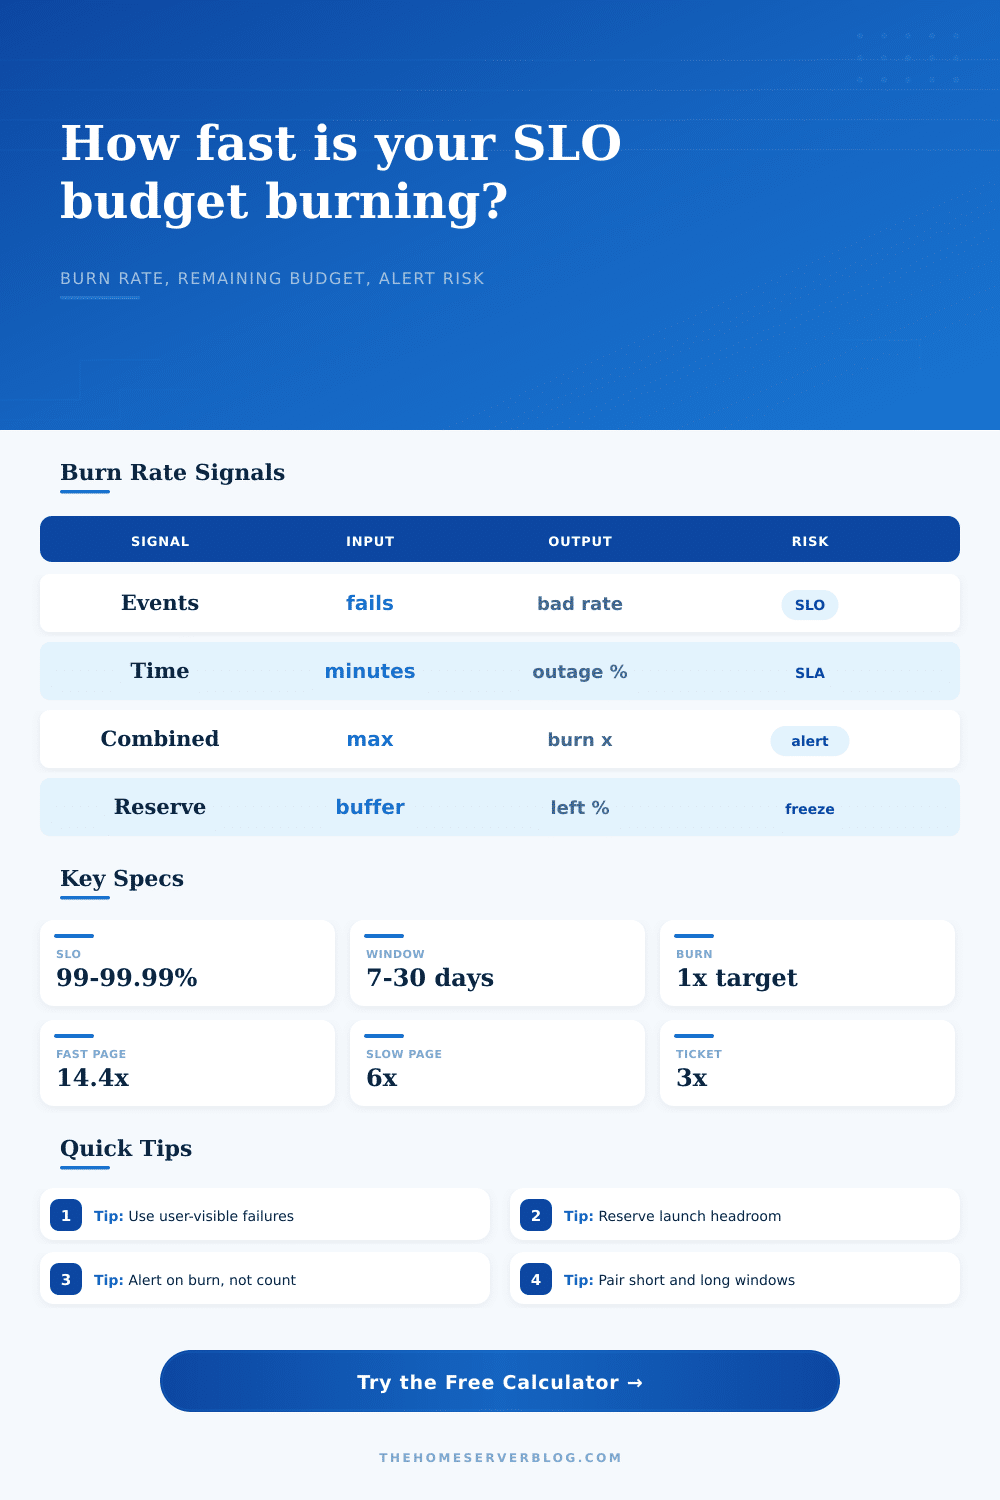
| Fast page | 14.4x | 5 min and 1 hour | Roughly 2% of budget in 1 hour |
| Slow page | 6x | 30 min and 6 hours | Roughly 5% of budget in 6 hours |
| Ticket | 3x | 6 hours and 3 days | Slow leak that still needs work |
| Info | 1x | 1 day and 7 days | Exactly spending budget pace |
| Freeze | Remaining low | Current SLO window | Reserve is nearly gone |
Telemetry source and denominator notes
| Source | Good Event | Bad Event | Practical Limit |
|---|---|---|---|
| Reverse proxy logs | 2xx, 3xx, selected 4xx | 5xx, timeout, upstream fail | Excludes traffic that never reaches proxy |
| Service metrics | Handled request counter | Error counter or timeout bucket | Needs stable labels and scrape health |
| Blackbox probe | Probe success | HTTP, TCP, DNS, or TLS fail | May miss per-user path issues |
| Browser beacon | Successful page or API span | Failed user action or long latency | Sampling and client blocking affect totals |
| Backup job log | Completed write or object put | Failed job, retry exhaustion, corrupt verify | Jobs are bursty, so use longer windows |
Common home lab SLO examples
| Service | Typical SLO | Primary Signal | Watch Closely |
|---|---|---|---|
| Home Assistant remote access | 99.9% | HTTP probe plus API logs | DNS, tunnel, certificate renewal |
| Jellyfin or Plex | 99.0% | Playback start success | Transcode saturation and storage stalls |
| Nextcloud | 99.5% | Sync and WebDAV success | Database locks and upload timeouts |
| Recursive DNS | 99.95% | Successful query rate | Upstream resolver and cache failures |
| VPN gateway | 99.9% | Login and tunnel probe success | ISP churn and dynamic DNS lag |
💡Practical burn-rate tips
This calculator estimates SLO burn behavior for planning and alert tuning. Match the inputs to your own SLI definition before using the result for paging or change-freeze decisions.
Your backup script now runs every night, you’ve got 4K video streaming from your media server to your TV, and DNS resolver is pointing correctly. All lights in your dashboard is green. Then, at 10 PM on a Friday night, the whole thing turns quiet after you burned up all your reliability budget earlier in the day trying to fix some trival bug. It didn’t crash, per se, but there was no more breathing room.
In home lab ops, hobbyists treats uptime as a binary state; it’s an all-or-nothing metric where things either work or they don’t. But reliability work at large recognize uptime as a currency, a limited one at that. Each failure cost a portion of the overall amount. The calculator above allow you to monitor how quickly you’re burning through it.
Why You Need an Error Budget
An error budget is based off the notion that perfection costs money (and isn’t necessary). You decide how much downtime you want to “spend” and therefore how much downtime you can “afford.” So if you say “my service level objective is 99.9 percent,” you’re basically saying “I’m willing to accept that my service might go down for roughly forty-three minutes each month.” That’s your budget, whether you use it up for gradual degradation, accidental outages, or planned maintenance. The trick is that most hobbyist don’t do this math until they need it, but by then it’s too late, the budget is exhausted and there is panic.
#1. What will you pay for? Firstly, define exactly what failure is for you. Is a single slow-loading music stream different than your status page going down with a 500? The source doesn’t provide an example comparing a single missing file to no files being backed up.
In this calculator, there’s the option to measure time-based outages, and also just a number of failed request; which makes sense if you’re monitoring something like a web API, where request counts is important. If you’re monitoring a VPN tunnel, then uptime minutes matter more. In combined mode, the calculator take the conservative route and uses whichever metric is worse, so you have to face the worst-case scenario instead of hiding behind averages.
It also knows that time is important: a burst of errors in a short window are often more damaging than a slow leak over a month. It’s like being hit by a bucketful; it’s a sudden, broken state that requires attention now. The app does this with multiple windows of events as well, so it can separate out the emergencies from normal noise. Maybe running through alerts at 14.4x uses up a page, but maybe 3x only generates a ticket. That way you’re not waking up for every little glitch, but if something is really on fire, you wake up.
You should of also be reserving some of your budget by setting aside 10 percent or more for maintenance and deployments. This tool allow you to do that. Think of it as your emergency fund in your bank account: You hope you won’t need it, but you’re glad it’s there when you do. A single minor incident will burn through your whole month’s allowance if you haven’t reserved anything, and now you’re stuck on a freeze, no pushing any updates.
It all depends on your telemetry source. Application logs will tell you if the code are working. Blackbox probes will tell you if the server is reachable. Real user monitoring will tell you if the experience is good. So if you mix those up, you’ll have a distorted view of reality. If you want to protect the experience, use the source that matches it. The page has a clear table showing how each kind of data source aligns with different reliability goals. I think you should use that as a reference.
But ultimately, it’s all a matter of tradeoffs. Do you want something that’s fast to develop? Do you want something with high availability? You rarely get both without some price tag. But if you track your burn rate, you’ll be able to consciously decide what tradeoff to make, and no longer will you guess; you’ll know you’re safe.
When the budget gets low, you halt. And when it’s in good shape, you go. This is how to transform chaos into control, and why the stream plays on while the server remains quiet. You get to keep the weekend free.