Storage Throughput Calculator
Estimate NAS or SAN read and write throughput from drive speed, disk count, RAID or vdev layout, workload mix, cache, protocol overhead, and network bottlenecks.
Estimated storage throughput
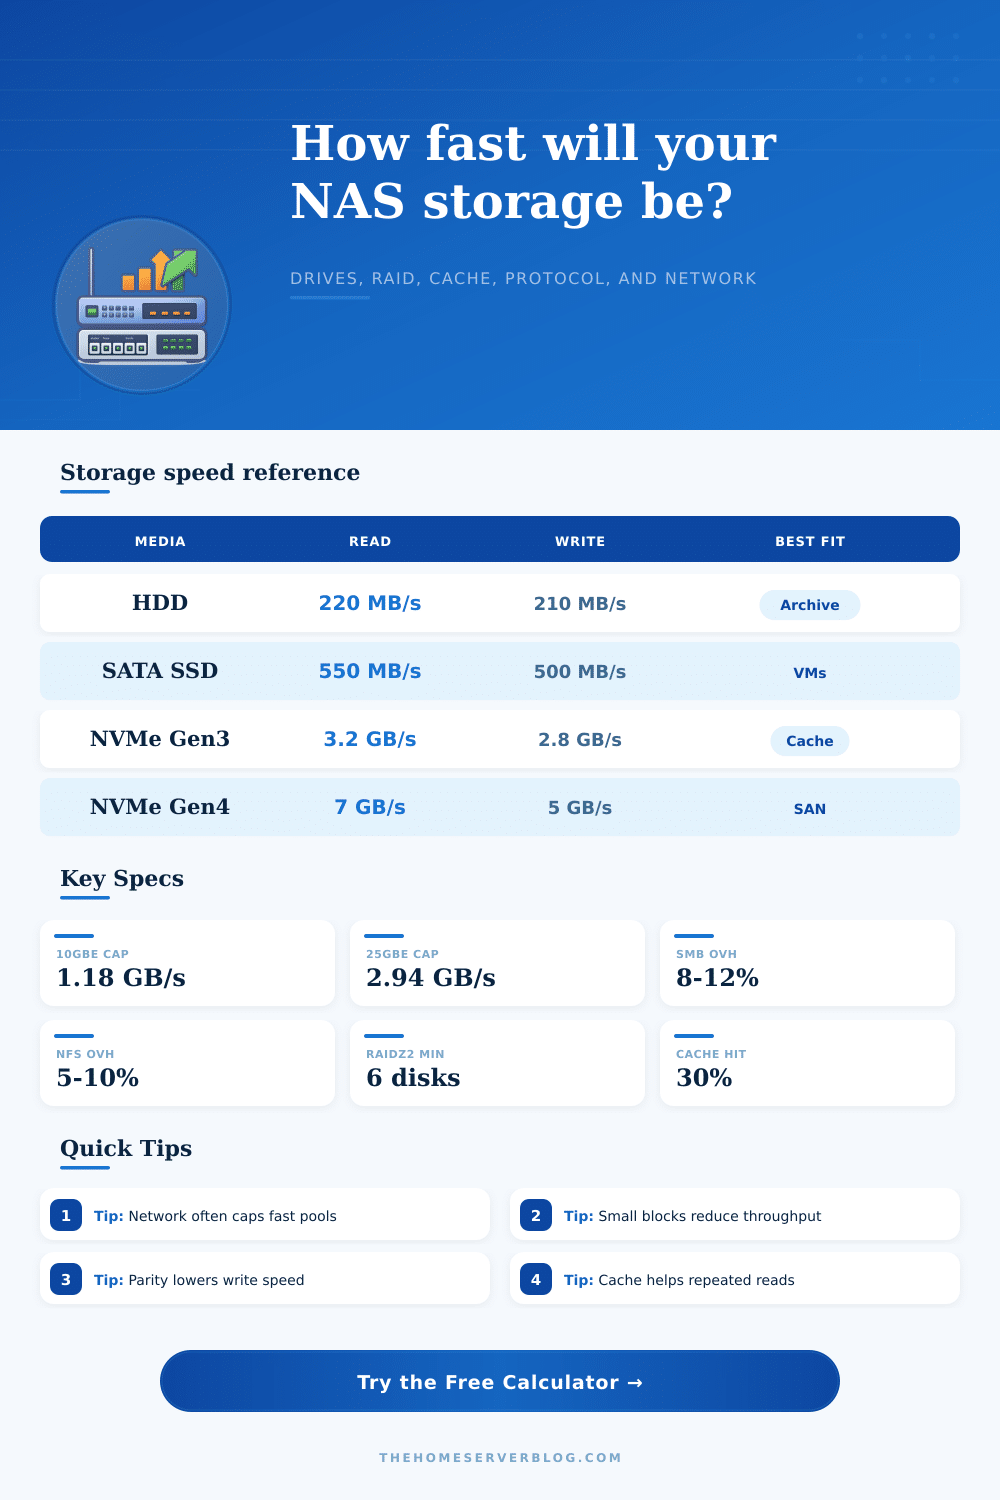
| Drive class | Read MB/s | Write MB/s | Best workload |
|---|---|---|---|
| 7200 RPM NAS HDD | 220 | 210 | Backups, media, bulk file shares |
| Enterprise HDD | 260 | 250 | Large sequential arrays and archival SAN tiers |
| SATA SSD | 550 | 500 | VM datastores, small NAS, low latency shares |
| 12G SAS SSD | 1000 | 850 | Dense virtualization and database LUNs |
| NVMe Gen3 SSD | 3200 | 2800 | Scratch space, cache devices, fast mirrors |
| NVMe Gen4 SSD | 7000 | 5000 | All-flash SAN and high-speed editing storage |
| Layout | Minimum disks | Read scaling | Write behavior |
|---|---|---|---|
| Single disk | 1 | 1 drive | 1 drive, no redundancy |
| RAID 0 stripe | 2 | All drives | All drives, no redundancy |
| RAID 1 mirror | 2 | Usually 1-2 drives | One-drive write speed |
| RAID 5 / RAIDZ1 | 3 | Data disks | Parity lowers sustained write speed |
| RAID 6 / RAIDZ2 | 4 | Data disks | Double parity lowers writes further |
| RAID 10 / mirror vdevs | 4 | All drives for reads | Half the drives for writes |
| Transport | Typical overhead | Single-link cap | Practical note |
|---|---|---|---|
| 1 GbE | 6-10% | 110-118 MB/s | Often caps HDD mirrors and small NAS units |
| 10 GbE | 6-12% | 1.05-1.18 GB/s | Good match for 4-8 HDDs or SATA SSD mirrors |
| 25 GbE | 5-10% | 2.7-2.95 GB/s | Useful for all-flash NAS and SAN hosts |
| SMB 3 | 8-12% | Depends on NIC | SMB Multichannel can use multiple links |
| NFS | 5-10% | Depends on NIC | Often efficient for Linux and hypervisor storage |
| iSCSI | 4-8% | Depends on NIC | MPIO helps multiple initiator sessions |
| Project | Typical pool | Network | Expected limiter |
|---|---|---|---|
| Family backup NAS | 2 HDD mirror | 1-2.5 GbE | Network before disk |
| Media server NAS | 6 HDD RAIDZ2 | 10 GbE | Parity writes or disks |
| Home lab VM store | 8 SATA SSD RAID 10 | 10-25 GbE | Network for reads, pool for writes |
| Video editing share | 8-12 HDD RAID 6 | 25 GbE | Disk count and block size |
| All-flash SAN | 6-12 NVMe mirrors | 25-100 GbE | Host bus, PCIe, or network |
| Backup repository | 8 HDD RAID 6 | 10 GbE | Write path and checksum load |
When building your own home lab, it might be that your files won’t transfer as quickly as you think they should, even though hard disks is spinning like mad and all the cables are plugged in. It feels almost like connecting via dial-up! How do I know? There’s this nifty storage throughput calculator. It can estimate SAN and NAS speed based off network limits, protocol overhead, cache, RAID or vdev layout, and drive specs. Use it before purchasing any hardware so you can identify bottlenecks.
You’ll find out that what clients gets is not necessarily what the drive specs say. This is where the largest trap lies. More disks don’t necessarily equal faster. Adding disks in a mirror config only increases your level of redundancy. Unless you’re reading a lot from the same disk, there’s no improvement for reads past a certain number. This tradeoff can be seen on calculator if you choose the RAID layout (or vdev layout) and then let it apply realistic scaling factors to your choice. For example: if you have six disks in RAID 6, it will account for the fact that each stripe has twice as much parity, which slows down writes.
Why Your Home Lab Is Slow
There’s much more to consider than simply size of the file you want to cram onto the platters or NAND chips. How many disk are talking at one time? Are they doing math calculations (parity bits) or moving around files? Make that call and suddenly things change entirely. Typically the low-key thief of performance is the network itself. You can get gigabytes per second from a pool of NVMe drives, but not if all those bytes has to cross a single 1 GbE connection. This tool takes a link’s rate and turns it into megabytes/second on the wire, with some efficiency hit to account for TCP/IP framing and other protocol overhead. In practical terms, SMB3 or NFS add administrative bloat to each packet, so you may be thinking you’re getting full line rate, while in reality everything slow down. If the network ceiling is less than what the pool could do, there you go, now you know where to put the money next. Chances are that’ll mean upgrading your switch rather than buying another disk. This could of involve enabling link aggregation.
In offhand planning meetings, we don’t give enough credit to cache behavior. New writes cost; repeated reads are cheap, so this is where you can tinker with cache hit ratios in the calculator. When you’re serving the same set of virtual machine template over and over again, RAM cache is doing a lot of the hard work that spinning hard drives could never do. Conversely, when you’re backing up huge sets of media files for the first time, the cache is basically being bypassed. Is the data hot or cold? That changes the numbers. Storage systems aren’t static pipes, they’re changing filters that treat familiar data different than fresh input. That’s why it works: for a reason.
Size of blocks does matter (more then enthusiasts will acknowledge). Sequential throughput is choked by small random blocks. This takes into account how block size affects the tool. This prevents false hope from synthetic benchmarks, which tend to use a large, easy size for their files. In the real world, mixed workloads including database transactions, media streams, email attachments, etc compete for bandwidth. Plan for the slowest layer as it’s going to break the whole chain.
The specs are overwhelming. On paper, NVMe Gen4 look great. But what good does that do you if your network tops out at 10 gigabits per second? Or maybe your host bus can’t keep pace? The calculator removes all of the moddern marketing glitz and reveals how much useful output you’re actualy getting after each real-world limitation reduces performance. You no longer buy based off what things might be capable of (instead), you buy based on what they’ll actually deliver for you. Storage sizing is less about raw power and more about finding the weakest link before it trips you up. This applies whether you’re constructing a SAN for enterprise databases or a media server for storing your family’s movies. This applies whether you’re constructing a SAN for enterprise databases or a media server for storing your family’s movies.
Find the weak link early on. Don’t try to brute force a fix, improve the architecture instead. And don’t forget, even if you have the fastest drive in the room, it won’t be any faster than the speed at which the cable carries the data out the door. When you plan with this in mind, you’ll save yourself from watching those transfer speeds crawl well after the hardware arrives.