Website Load Time Calculator
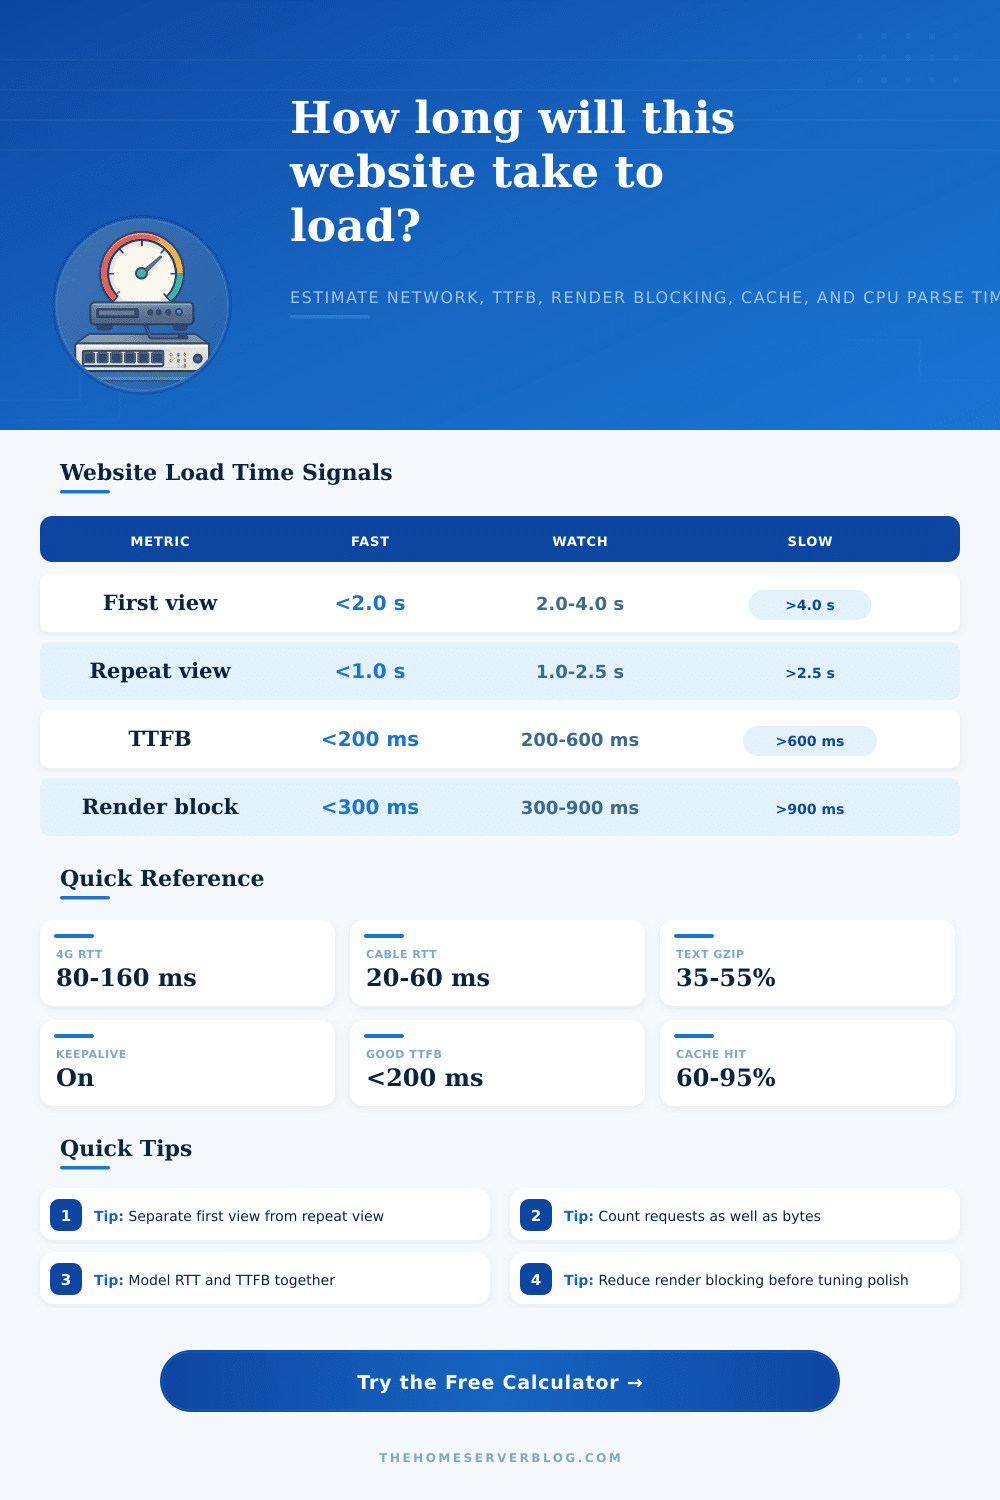
Estimate first-view and repeat-view load time from page weight, bandwidth, latency, request count, keepalive, TTFB, compression, render blocking, browser cache hits, and CPU parse time.
Timing breakdown
Share of first view
| Stage | What it includes | Good range | Common fix |
|---|---|---|---|
| TTFB | DNS, connect, TLS, routing, server work, and first byte of HTML. | 100 to 300 ms | Use CDN edge, cache HTML, reduce backend query time. |
| Connection setup | Fresh handshakes and negotiation before resource transfer. | 0 to 300 ms | Enable keepalive, HTTP/2, HTTP/3, TLS 1.3, and connection reuse. |
| Transfer | Compressed bytes divided by effective bandwidth. | Under 1.5 s for first view | Compress text, resize images, remove unused JavaScript. |
| Request latency | Round trips caused by request count, dependency depth, and host spread. | Under 500 ms | Bundle carefully, preload critical files, reduce third-party hosts. |
| Render blocking | CSS, synchronous scripts, fonts, and resources that delay first render. | Under 300 ms | Inline critical CSS, defer non-critical JS, optimize font loading. |
| CPU parse | JavaScript parse, execute, style calculation, layout, and decode work. | Under 500 ms | Ship less JS, split routes, reduce hydration and heavy widgets. |
| Scenario | Typical first view | Repeat view expectation | Main risk |
|---|---|---|---|
| Static docs | 0.8 to 1.8 s | 0.4 to 1.0 s | Fonts, syntax highlighters, and uncompressed assets. |
| Blog article | 1.5 to 3.5 s | 0.8 to 2.0 s | Hero image, theme CSS, analytics, and web fonts. |
| Marketing page | 2.0 to 5.0 s | 1.2 to 3.0 s | Animations, third-party tags, video, and large JS bundles. |
| Product page | 2.5 to 6.0 s | 1.5 to 3.5 s | Image gallery, reviews widgets, recommendations, and personalization. |
| App dashboard | 2.0 to 7.0 s | 1.0 to 4.0 s | JavaScript parse time, data requests, charts, and auth redirects. |
| Ad-supported news | 4.0 to 12.0 s | 2.5 to 8.0 s | Ad auctions, trackers, late scripts, and request waterfalls. |
| Optimization | Load-time component | Typical impact | Best first check |
|---|---|---|---|
| Compress HTML, CSS, JS, and JSON | Transfer size | 20% to 70% of text bytes | Verify Brotli or gzip response headers. |
| Resize and lazy-load images | Page weight and critical bytes | 25% to 75% of image bytes | Audit rendered dimensions versus intrinsic dimensions. |
| Reduce request count and host spread | RTT and connection setup | 100 ms to several seconds | Inspect waterfall gaps and third-party domains. |
| Defer non-critical JavaScript | Render blocking and CPU parse | 200 ms to 2 s | Find long tasks and scripts before first render. |
| Improve cache headers | Repeat-view transfer | 40% to 95% of repeat bytes | Check cache-control, ETag, immutable hashes, and CDN TTL. |
| Improve TTFB | Start of all rendering | 100 ms to 1 s+ | Separate CDN hits, origin misses, and backend time. |
When a page hangs, you’ve already lost the user’s trust. And more importantly, they don’t see this as a technical failure. It simply feels like you dropped ball and didn’t fulfill your promise. If most devs is honest with themselves, they’d blame bandwidth: “if only we had faster pipes, this wouldn’t happen.”
But speed have nothing to do with raw throughput. It’s all about when the browser ask if it can go ahead. But look at a waterfall chart, and what do you see? It is a tale of delay. Every request are a round trip. And every handshake is another expense in time. Downloading a dozen files from three domains has the effect of paying an invisible tax on a user’s attention: Handshakes cause the browser to sit there waiting for things to happen, before it’ll download anything. And that’s why the hidden latency costs are split based off by the above calculator; so you can see exactly how many seconds have slipped away.
Why Web Pages Load Slowly
Think of Time To First Byte as the time it takes for server to greet you. Once you start that clock ticking down your budget, the browser has no idea how big this page is. That half-second the server spend deciding what HTML to send is actualy costing you half a second of your budget. Sure, a good CDN help. Packets travel shorter distances, which puts them closer to user and makes loading faster. But nothing can help if your backend logic isn’t optimized, or your database queries takes too long. Bad architecture won’t be compressed out.
The other problem is render-blocking resources. These are the artificial walls where browser stops painting while waiting for files to download and run. You can remove these by inlining critical CSS and deferring unimportant JavaScript. This move more of this work off the main thread, which results in earlier visual feedback. How users perceive speed is what they visually see, not when the last byte lands.
Similarly, moddern web sites send lots of Javascript to do things that used to be done by simple HTML. That require processing power to parse and run it. It may only cost you milliseconds on a high end desktop system, but it freeze your interface for seconds on an old Android phone running out of memory. What’s happening post-download? Audit it. Maybe adding more bandwidth won’t help, if the parser is spending half a second untying a big bundle.
For your second visit, caching makes all the difference. If done right, no network request will be needed, the browser grabs files directly off of local storage. This mean repeat visitors have almost zero transfer weight. But a common deployment strategy break that loop, because it requires a full reload at each push. You can set your hashed assets to not bust the cache, so they remain in place (including the good ones) and any changes gets loaded instantly.
The world’s not as wired as you think it is. What loads quickly on your fiber connection in Silicon Valley fails to load on 4G out in the country where round trip time is much greater than. The slower the network, the more you see the weaknesses: Uncompressed images, unminified scripts and needless third party trackers gets punished with compounded delays. Testing different scenarios exposes these flaws that your blazingly fast connection at home masks.
The race to zero is the wrong way to think about fixing load time. The race is a balance between tech restraint and visual richness. How do we get enough data in there to tell our story? But how little can we get away with to not tax the device rendering it?
Small wins compound over time. Removing one unused script, optimizing a hero image, or caching fonts can shave hundreds of milliseconds off the total. When stacked they would of compound into full seconds. It’s about respecting other people’s time. It’s about not taking up too much of it or getting things done quickly with your fingers.
Tools let you know where the distance between what you expect and what actually happens is. And when you get rid of that distance you don’t have to guess at why people is leaving. You just build something they’ll want to stick around on.