Website Page Weight Calculator
Estimate raw page weight, compressed transfer size, cache-adjusted repeat load, asset mix percentages, and the gap to your mobile performance budget.
Asset Mix
Transfer Details
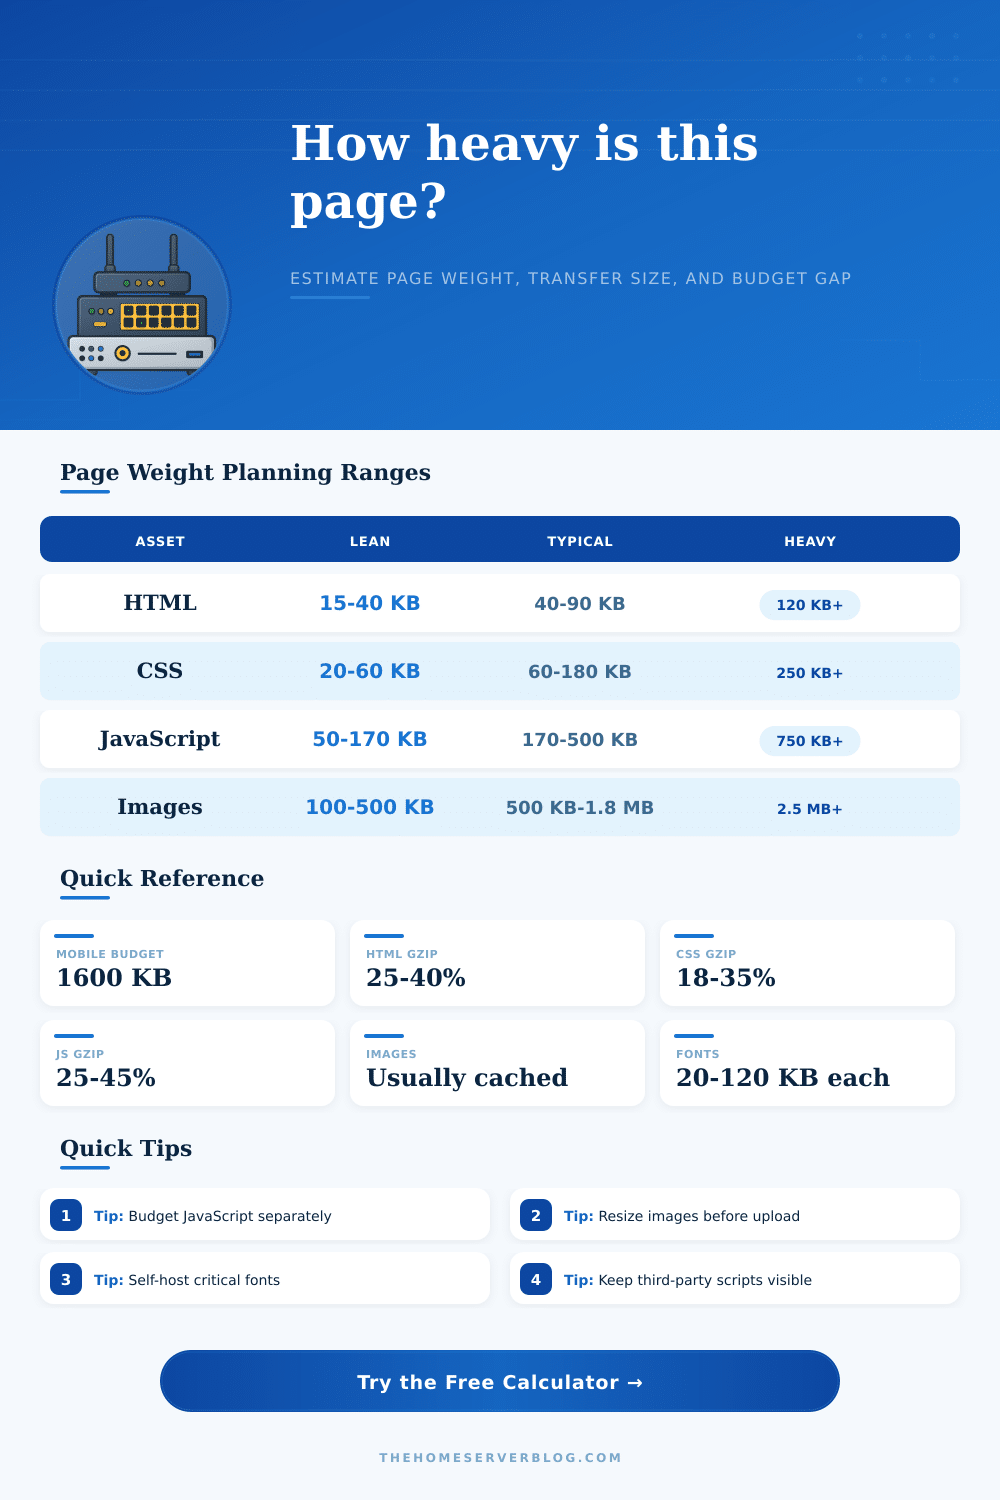
| Asset Type | Good Range | Watch When |
|---|---|---|
| HTML | 15-90 KB | Server-rendered pages exceed 150 KB or duplicate markup. |
| CSS | 20-180 KB | Unused framework CSS ships on every page. |
| JavaScript | 50-500 KB | Hydration, analytics, and widgets cross 750 KB. |
| Images | 100 KB-1.8 MB | Hero images are not resized or next-gen encoded. |
| Fonts | 20-240 KB | Multiple families, weights, and icon fonts load early. |
| Video embeds | 0-700 KB | Players load before user intent. |
| Page Type | Reasonable Mobile Budget | Primary Risk |
|---|---|---|
| Docs or knowledge base | 600-1200 KB | Syntax highlighters and fonts. |
| Blog article | 800-1500 KB | Hero image and social embeds. |
| Landing page | 1200-2200 KB | Animations, video, and trackers. |
| Ecommerce product | 1500-3000 KB | Image gallery and reviews widgets. |
| Dashboard app | 1000-2500 KB | JavaScript bundles and chart libraries. |
| News or ad-supported page | 2000-5000 KB | Third-party tags and auctions. |
| Optimization | Typical Saving | Best For | Tradeoff |
|---|---|---|---|
| Resize and convert images to WebP/AVIF | 25-70% of image weight | Product, portfolio, blog, and marketing pages | Needs responsive image generation and QA. |
| Remove unused JavaScript | 10-45% of JS weight | SPAs, dashboards, WordPress themes | Requires route-level testing after trimming. |
| Code split non-critical features | 15-55% first load JS | Apps, forms, modals, charts, editors | May add async loading states. |
| Inline critical CSS and defer the rest | 10-35% render-blocking CSS | Landing pages and blogs | Build pipeline must extract critical rules. |
| Subset fonts and preload one face | 20-80% of font weight | Editorial and branded pages | Language coverage must be checked. |
| Lazy-load embeds and third parties | 30-90% of offscreen widget transfer | Video, maps, social, chat, ads | Some widgets initialize after interaction. |
The developer thinks: I’ve built this nice-looking landing page that displays well on my screen, but it’s slow on mobile data. I look at the source code and realize that it load three megabytes of JavaScript to display a contact form and headline. That’s not how we developers thinks about web performance; it’s a fundamental failure in structure.
Most development teams approach the problem only when performance metrics start failing, which means that they solves problems but don’t understand what caused them. When you plug in the sizes of your assets, it’s a numbers game, but the calculator does that math for you. You won’t have to guess about cache behavior or compression ratios. You’ll see how much of the raw file size actualy gets transferred to the end-user.
Why Fast Websites Are Important
Raw weight is something static on your server. Transfer weight depend on what makes it all the way to the user’s device before reaching their browser cache. First, check out your JavaScript budget. Many of today’s frameworks is built to let developers send over whole app shell for pages which only really require a handful of features. This can hurts mobile performance. If all you’re doing with a page is displaying some images and text, you don’t really need a full-blown data visualization library or complicated state management to render a typical blog post.
Plug in your JS size into the tool, then see how much of that weight falls off under compression. The text-based stuff will compress just fine but it will still take up space being parsed on the client side. And it’ll get parsed on the main thread, blocking rendering. Small distinction but it makes a difference when it comes to user retention.
But images are images. They’re already optimized binary data. Text algorithms aren’t nearly so aggressive about compression. But also, images accounts for the biggest chunk of visual weight on most sites. The catch is: you can’t just go into Photoshop, slap some resizing commands on an image and call it done. You’ll want to be using some sort of moddern format, either WebP or AVIF, to really see meaningful gains while maintaining same quality. If your site is heavy with media, you’ll get a bigger win from optimizing those files then shaving ten kilobytes off your CSS.
But there’s another layer of complexity most teams overlook: third-party scripts. Ad networks, analytics, chat widgets, they inject their own JavaScript bundles and requests into the page that you don’t control. Often these are loaded at different times to help initial paint times, but they adds up pretty quick in terms of total transfer size. With the tool, you can estimate the overhead of third-parties so you can get a sense of just how much of your mobile budget go to vendors instead of your own content. Knowing that is key if you want to optimize it.
For repeat visitors, cache changes everything. It might be okay if something take a while to load on the first visit, but once it loads instantly from cache, all is forgiven. The majority of people who come back do so; or else they send others to URLs of things that are already in cache. When setting the cache hit percentage in the calculator, use a realistic figure based off how often your assets is likely to change over time (e.g., if you’re doing lots of builds that bust the cache, you’ll see less of a savings for repeat visits). Proper cache headers and stable file names aren’t just details for DevOps folks, they’re performance features.
Budget concepts are guidelines; they’re not hard rules. For example, a simple, text-only site may be fine at 1 megabyte while an image-rich e-commerce product page won’t cut it. You should of considered this sooner. The page’s reference table show that by context. You can see what’s reasonable for a dashboard app vs. It is a news article. Don’t think of these as ceilings but as ranges to help you set expectations.
In short, this is all about balancing load time vs the richness of features. There’s no such thing as infinite features at zero latency. It’s not that every page should be exactly one kilobyte; it’s that every byte on every page deserve to be there. Audit the biggest ones first, determine if they’re really needed, and follow the data, it will tell you where to focus next. Measure rather than guess, and things becomes a lot more clear.