HomeServerBlog Wi-Fi 6 planning tool
Wi-Fi 6 OFDMA Resource Unit Calculator
Estimate how Wi-Fi 6 OFDMA resource units fit inside a channel, how many users can be scheduled per PPDU, and what PHY rate, goodput, airtime load, and packet service budget your RU plan can support.
1RU deployment presets
2OFDMA and radio inputs
Formula breakdown
RU plan verdict
3RU size comparison grid
4Live OFDMA planning metrics
How many scheduled rounds are needed to serve all active users once.
Approximate payload packet service at the selected packet size.
Goodput slice after the selected uplink and downlink split.
Goodput slice available for trigger-based uplink OFDMA.
5RU and 802.11ax reference tables
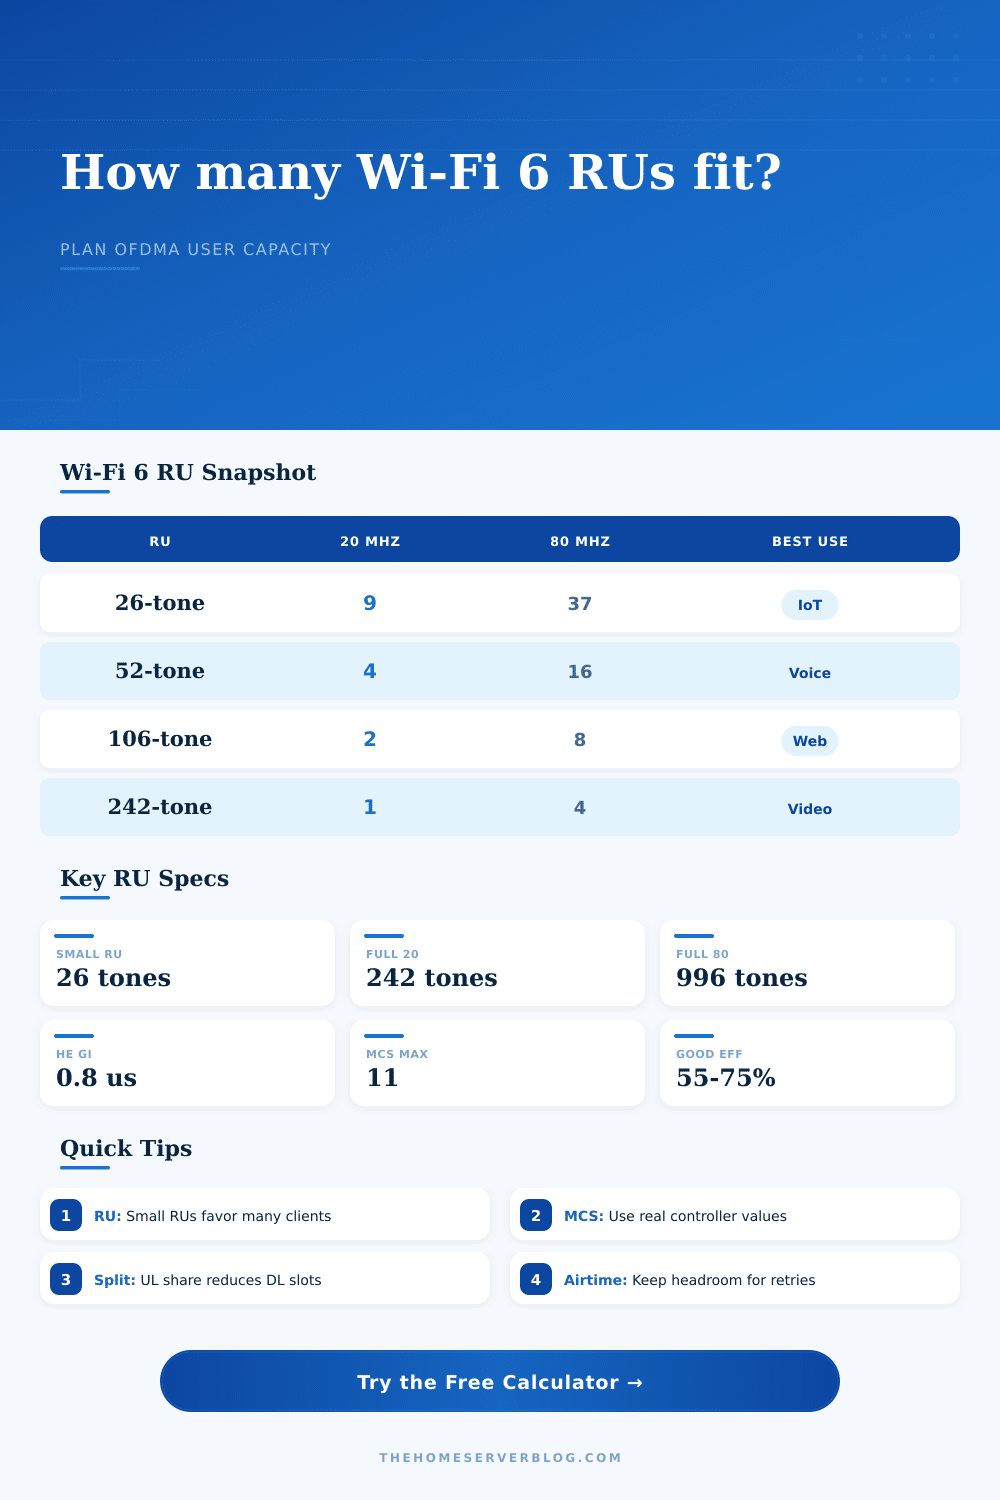
| RU size | 20 MHz | 40 MHz | 80 MHz | 160 MHz |
|---|---|---|---|---|
| 26-tone RU | 9 users | 18 users | 37 users | 74 users |
| 52-tone RU | 4 users | 8 users | 16 users | 32 users |
| 106-tone RU | 2 users | 4 users | 8 users | 16 users |
| 242-tone RU | 1 user | 2 users | 4 users | 8 users |
| 484-tone RU | Not used | 1 user | 2 users | 4 users |
| 996-tone RU | Not used | Not used | 1 user | 2 users |
| 2x996-tone RU | Not used | Not used | Not used | 1 user |
| Formula | Calculator expression | What it means | Watch item |
|---|---|---|---|
| RU fit | floor(channel / RU) | How many users can be scheduled in one OFDMA PPDU. | Actual AP schedulers can mix RU sizes, so this is same-size planning. |
| PHY per RU | tones x bits x code x NSS / symbol | Approximate HE payload-rate basis for one resource unit. | Pilot tones, coding, GI, and implementation details affect exact rates. |
| Goodput | PHY x RUs x efficiency x overhead | Usable payload rate after OFDMA and scheduling factors. | Retries and legacy clients reduce the real result. |
| Airtime load | demand / goodput | How much of the modeled payload budget is consumed. | Keep spare airtime for beacons, probes, retries, and bursts. |
| MCS range | Modulation | Coding | Typical OFDMA use |
|---|---|---|---|
| MCS 0-2 | BPSK / QPSK | 1/2 to 3/4 | Long range, weak clients, IoT, and conservative uplink scheduling. |
| MCS 3-5 | 16-QAM / 64-QAM | 1/2 to 2/3 | Mixed rooms, phones at moderate RSSI, and busy home networks. |
| MCS 6-9 | 64-QAM / 256-QAM | 3/4 to 5/6 | Good 5 GHz or 6 GHz users with low retries and clean airtime. |
| MCS 10-11 | 1024-QAM | 3/4 to 5/6 | Near-AP Wi-Fi 6 clients and high-rate scheduled downlink traffic. |
| Deployment pattern | RU choice | Direction split | Planning note |
|---|---|---|---|
| IoT telemetry VLAN | 26-tone or 52-tone | Mostly uplink | Many low-rate clients benefit from small RUs and predictable trigger windows. |
| Voice and meeting tablets | 52-tone or 106-tone | Balanced | Moderate RUs keep latency controlled without starving individual users. |
| Office laptop mix | 106-tone or 242-tone | Mostly downlink | Good balance for web, sync, and conferencing on 80 MHz APs. |
| VR or same-room workstation | 484-tone or 996-tone | Mostly downlink | Large RUs trade multi-user count for stronger per-user throughput. |
| Mesh or point-to-point backhaul | 996-tone or 2x996-tone | Workload based | Usually behaves closer to single-user scheduled capacity than dense OFDMA. |
6Wi-Fi 6 OFDMA tips
Beyond increased throughput for streaming, Wi-Fi 6 is also for handling multiple device talking simultaneousy. Think of traditional Wi-Fi as a one-lane road (every device must wait its turn). With OFDMA, that spectrum get broken up into smaller lanes and now an access point can talk to multiple user simultaneously.
Many people makes this mistake: they prioritize speed for their own laptop instead of freeing up bandwidth when everyone in the office log in. This enables you to think in terms of resource units, or RUs, which are slices that you can see on the calculator. Rather than thinking about throughput, you think about device density: How much do I need?
How to Share Wi-Fi Fairly
That begins with your choice of channel width, which tells you how many lanes there are. A smaller 20 MHz channel is going to have less room different than a bigger 80 MHz channel. But then you decide how you want to carve up that channel. Do you want to get as many users as possible per transmission window (smaller 26-tone RUs) or do you want to give each user a bigger piece (larger 242-tone RUs), even if it’s at the expense of serving fewer users? It’s a speed versus capacity tradeoff.
The latter is ideal for Internet of Things device that send small data packets; the former serve nine users in a single transmission window. Next, you enter how many actual customer you think will be connected. That’s the part where most people screw up with their plans. They believe that their access point can handles hundreds of devices, but Wi-Fi is a shared medium. Adding more users mean everyone gets a smaller slice of air time.
The tool models this by taking all available goodput and dividing it by the number of users. Then it factors in efficiency losses, guard intervals, and other extra costs. It tell you how much bandwidth each device gets. Compare that against your target traffic per user. If the former is less then the latter, your plan is overcrowded.
Note that the split between downlink and uplink is key: Most traffic goes one way, yet video conferencing and cloud backups pushes lots of data upstream these days. Spend too much time scheduling downlink and your voice handset or camera will experience lag. The calculator accounts for this split and automatically reduces available budget to match; i.e., you see how it will perform in both directions, realisticly.
The other key element is MCS (Modulation and Coding Scheme). The MCS tell how high your signal can go theoreticaly, but since real-world conditions rarely support those maximums, it’s better to use a conservative estimate for your planning. However, things don’t work like that in the real world. Clients with weaker antennas or those at edge of a cell will negotiate a lower MCS. A good planning strategy use a conservative estimate so there aren’t any surprises when the performance isn’t as advertised.
With this feature, you’re able to choose the MCS most of your clients are likely to adopt and thus your calculations of goodput reflect what’s going on in the field, rather than what makes marketing charts look pretty. The last component is airtime efficiency. A lot of Wi-Fi’s time is spent sending management frames, acknowledgements and handshakes instead of data. That’s wasted time, which is shown by the efficiency percent in the tool. Lower numbers mean more overhead are eating up your usable bandwidth.
Slide this around to get an idea of just how much room you have until your network starts to feel slow. With this in mind, OFDMA becomes less of a buzzword and more of an engineering reality: instead of wondering if your access points are up to the task, you know exactly what’s possible. You should of not need to max out all metrics, but rather achieve a balance that allows each user their share of airtime. That is why it pays off to calculate resource units before deploying anything. This helps you create a network that is efficient rather than just powerful, which makes it feel fast.