HomeServerBlog Wi-Fi planning tool
Wi-Fi Channel Overlap Calculator
Estimate how much two Wi-Fi channels collide by comparing band, primary channel, channel width, neighbor width, signal separation, AP density, clients, spectral mask tolerance, and your design threshold.
1Overlap presets
2Channel overlap inputs
Overlap breakdown
Planning verdict
32.4 / 5 / 6 GHz comparison grid
4Live planning metrics
Modeled occupied spectrum for your selected AP channel.
Modeled occupied spectrum for the neighboring Wi-Fi channel.
Frequency separation between the two channel centers.
Practical spacing advice from the overlap model.
5Channel overlap reference tables
| 2.4 GHz plan | Center spacing | Overlap behavior | Planning note |
|---|---|---|---|
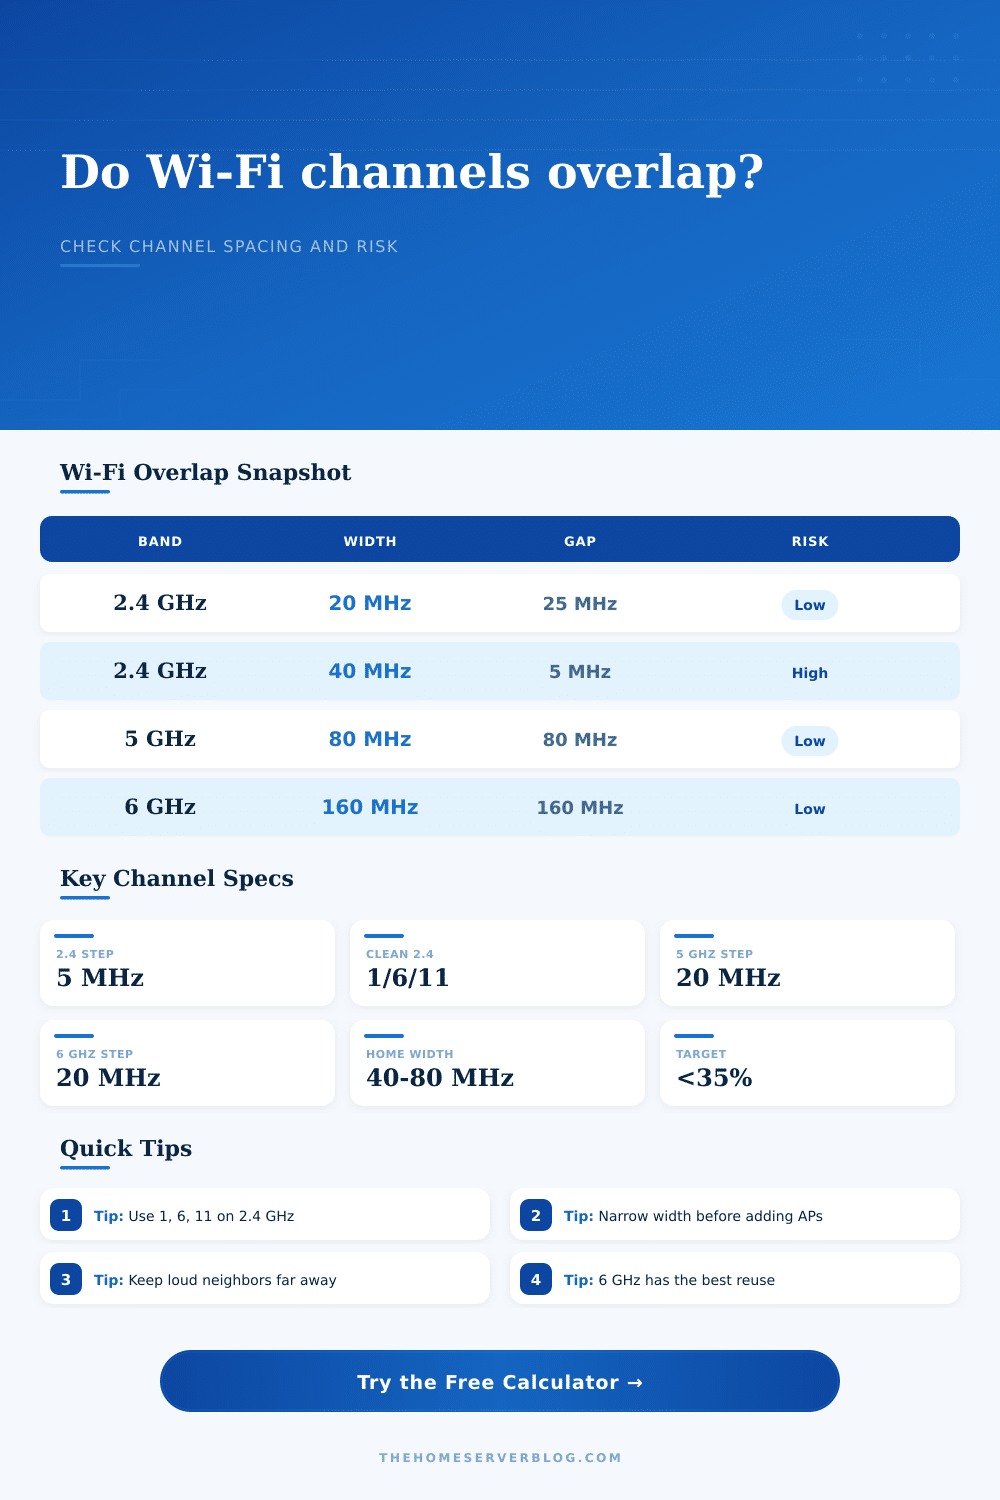
| Channels 1, 6, 11 | 25 MHz apart | Clean | Best everyday 20 MHz plan in regions that use channels 1 through 11. |
| Channels 1 and 3 | 10 MHz apart | Partial | Both cells can hear energy in the same occupied spectrum. |
| Channels 6 and 6 | 0 MHz apart | Co-channel | Not adjacent overlap; APs share one contention domain. |
| 40 MHz bonding | Very tight | Risky | Usually consumes too much of 2.4 GHz for dense homes or apartments. |
| 5 GHz width | Typical spacing | Overlap behavior | Good fit |
|---|---|---|---|
| 20 MHz | One channel block | Strong reuse | Dense AP plans, offices, voice, and homes with many neighbors. |
| 40 MHz | Two blocks | Balanced | Home labs, cameras, and moderate-density multi-AP networks. |
| 80 MHz | Four blocks | Watch DFS | Fast clients when the adjacent 80 MHz blocks stay clear. |
| 160 MHz | Eight blocks | Tight reuse | Clean point-to-point links or same-room high-throughput clients. |
| 6 GHz width | Channel room | Overlap behavior | Planning note |
|---|---|---|---|
| 20 MHz | Many choices | Very clean | Great for dense reuse, although peak client speed is lower. |
| 40 MHz | Wide pool | Clean | Practical for mixed 6 GHz homes and small offices. |
| 80 MHz | Good pool | Balanced | Common Wi-Fi 6E and Wi-Fi 7 client width. |
| 160 MHz | Fewer choices | Manageable | Works best when AP placement keeps same-width cells separated. |
| Overlap score | Meaning | Likely symptom | Practical response |
|---|---|---|---|
| 0 to 15% | Good guard gap or weak neighbor | Normal airtime sharing | Keep the plan and confirm with retry rate. |
| 16 to 35% | Noticeable edge overlap | Occasional retry bursts | Prefer lower width or a wider channel gap. |
| 36 to 60% | Heavy adjacent-channel pressure | Lower throughput near cell edges | Move channel, reduce power, or narrow both channels. |
| 61% or more | Severe overlap or co-channel reuse | Sticky roaming and high airtime load | Replan the channel set before adding more APs. |
6Wi-Fi overlap tips
The screen comes alive: Thirty seconds in, you’re still connected to a video call. Then it turns to a slideshow, pixelating each person’s face. You look at your signal bars. You have full bars. Something doesn’t add up.
On the surface, everything seem to be working fine. But most of the time, your router isn’t busted. Rather, your Wi-Fi spectrum is crowded. On the very same frequency as your Zoom meeting, your next-door neighbor is streaming a 4K movie. They aren’t stealing your bandwidth. They’re making noise.
Stop Chasing Signal Bars
The calculator above will run the math for you. But first, what does that noise mean? People view wireless channels as if they were radio stations. If I’m on channel 6 and my neighbor’s on channel 11, we’re in different lanes, right? That make perfect sense for FM radio. For Wi-Fi it makes no sense whatsoever.
Wi-Fi isn’t a nice, rectangular block of energy. It’s a fuzzy cloud of energy that leaks all over the place. If there’s a wide channel next to another wide channel, the two will leak into each other. This is called adjacent channel interference. Because both channels shows up strong to standard signal meters, this interference is invisible. Instead, data simply stops sending packets.
This is where most folks go off track. They pursue signal strength rather than pursuing clean spectrum. The 2.4 GHz band is especially gnarly. Only three channels aren’t overlapping. And everybody uses them. In an apartment building? Those three are likely packed with dozens of other network.
You can see what I’m talking about in the calculator. It doesn’t just tell you if your channels overlap. It tells you actual airtime risk; how many clients are jockeying for a shared piece of the air. Twenty laptops, ten phones, and eight smart home devices all on one clogged channel? The network isn’t slow because it can’t get data fast enough; its slowed by traffic jams. Each device has to take its turn waiting while the rest speak. It’s like being in a room where only one person can talk at a time. Put enough people there, and no one gets a word in.
Switching to the 5 GHz band (or even better, 6 GHz) provide breathing room, but with some new trade-offs. For one thing, those wider channels allows for faster speeds, but at the expense of size: a wide channel uses more spectrum. An 80 MHz channel may be fast, but it’s also a big fat target for interference. When you expand your channel to increase speed, that reduces the number of channels available for use by your other APs.
That tension is modeled in tool above. It balances the distance between your channel and your neighbor’s with the width of yours. Is the gap too narrow? Then the spectral mask limit kicks in. This is a fancy way of saying how much energy bleeds over onto the next channel. Abstract sounding, right? But it directy translates into lag. The bigger the gap, the smaller the bleed. The smaller the bleed, the higher the throughput. This is all spelled out on the page. The reference table makes that clear.
This shows what happens with different widths in real world. In densely packed situations, using a 20 MHz width on 5 GHz tend to be the right move. Sure, it’s not as sexy as those big 160 MHz bond numbers get thrown around as headlines, but it works. And when you’re trying to get a file up and need it error free, reliability win out over pure speed. You should of focused on stability.
With the calculator, you can test this theory. Plug in your own configuration. Tweak the number of client. Alter the channel width. Watch how the airtime risk change. No more guessing about your channel plans. No one size fits all.
Where do you fit in? Your neighbor’s. What channel width can you get away with? How much narrower or wider can they tolerate? Go bigger if they’re going narrow. Get smaller if they’re taking up more bandwidth then they should and blast everything on their dial. It is like musical chairs. You don’t want the prize for having the most obnoxiously loud signal. You want the quietest lane.
And when you realize that it isn’t about power but about space, about overlap, you begin to see the network differently: You stop chasing bars and start chasing the emptiness of air. That’s where the sweet spot is located.